Check out my overview of Chrome DevTools if you’re new to them
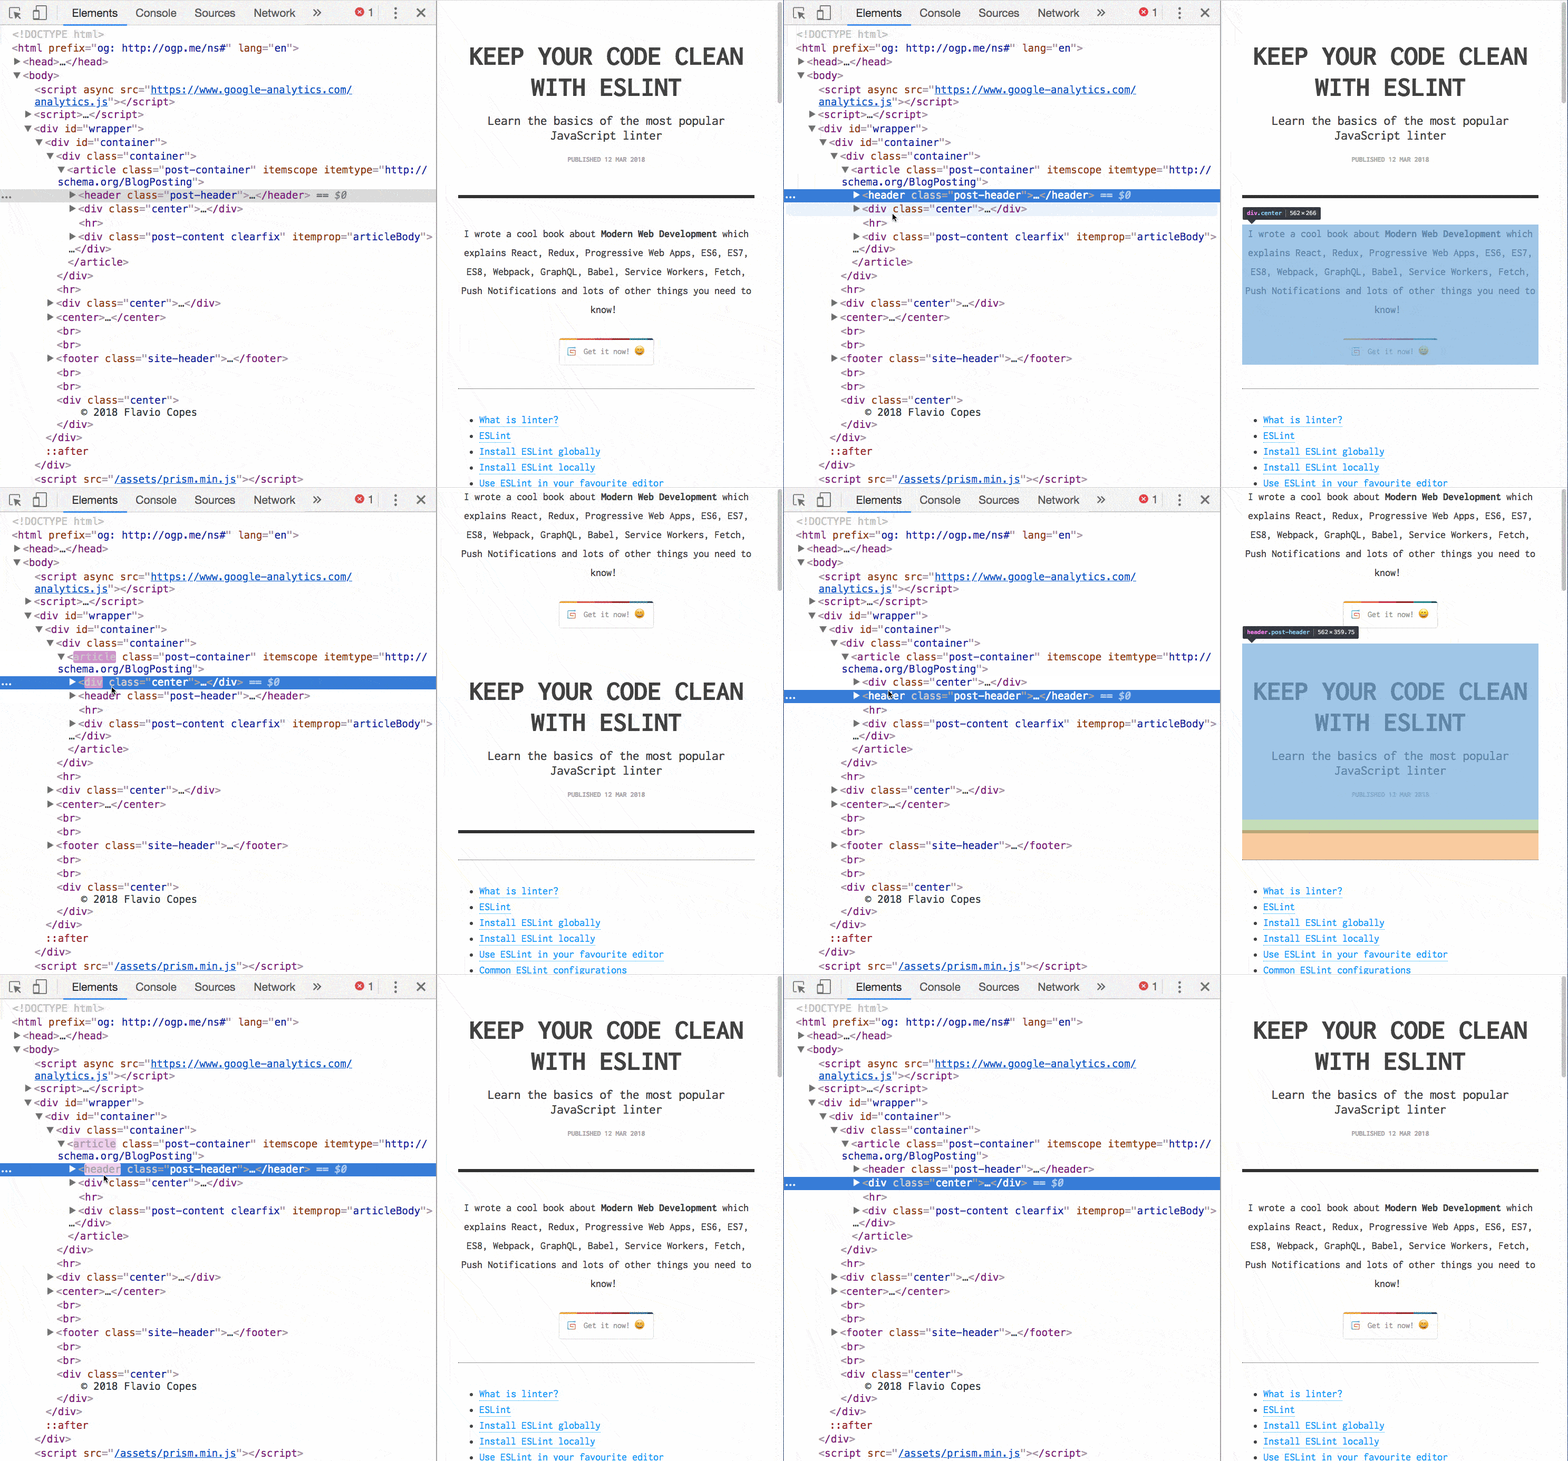
1. Drag-and-drop in the Elements panel
In the Elements panel, you can drag and drop any HTML element and change its position across the page
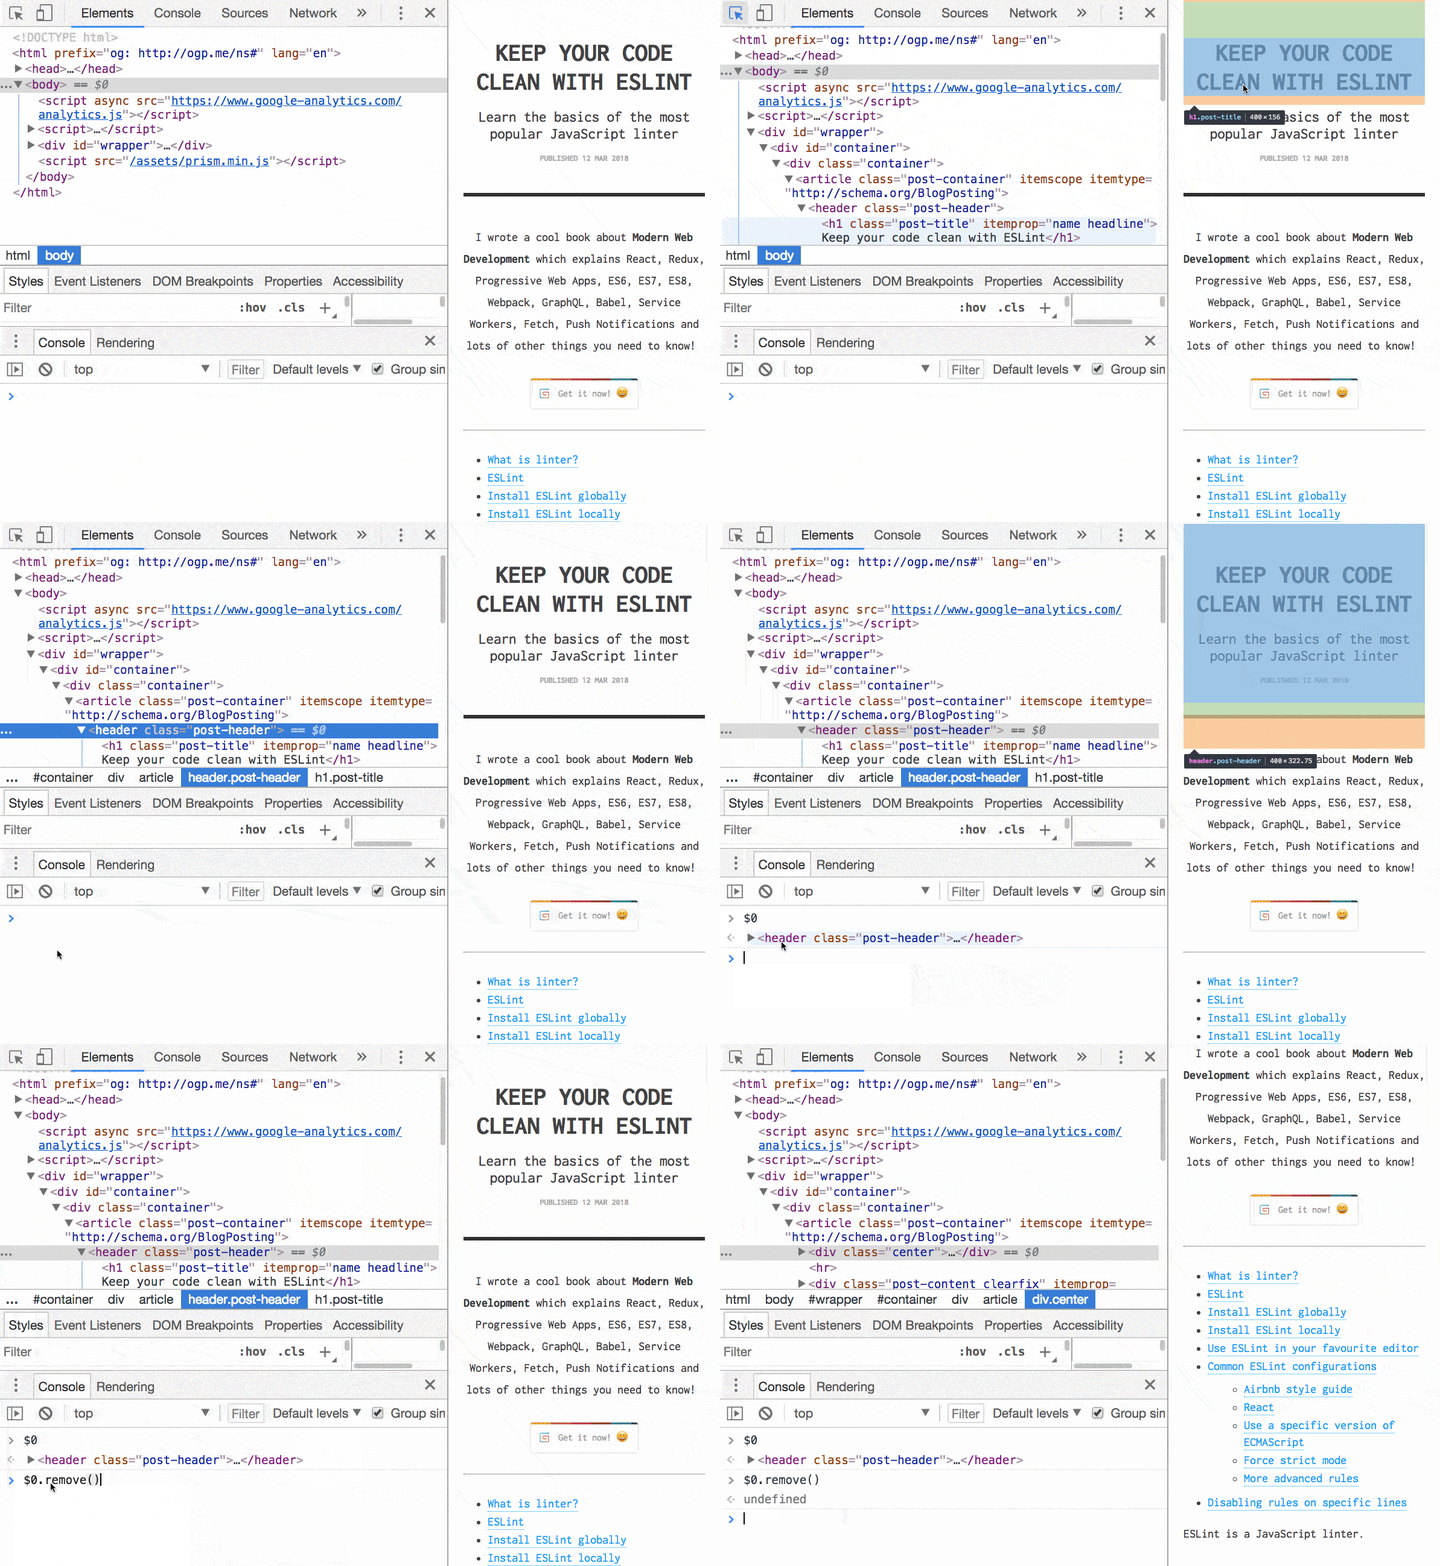
2. Reference the currently selected element in the Console
Select a node in the Elements panel, and type $0 in the console to reference it.
If you’re using jQuery, you can enter $($0) to access the jQuery API on this element.
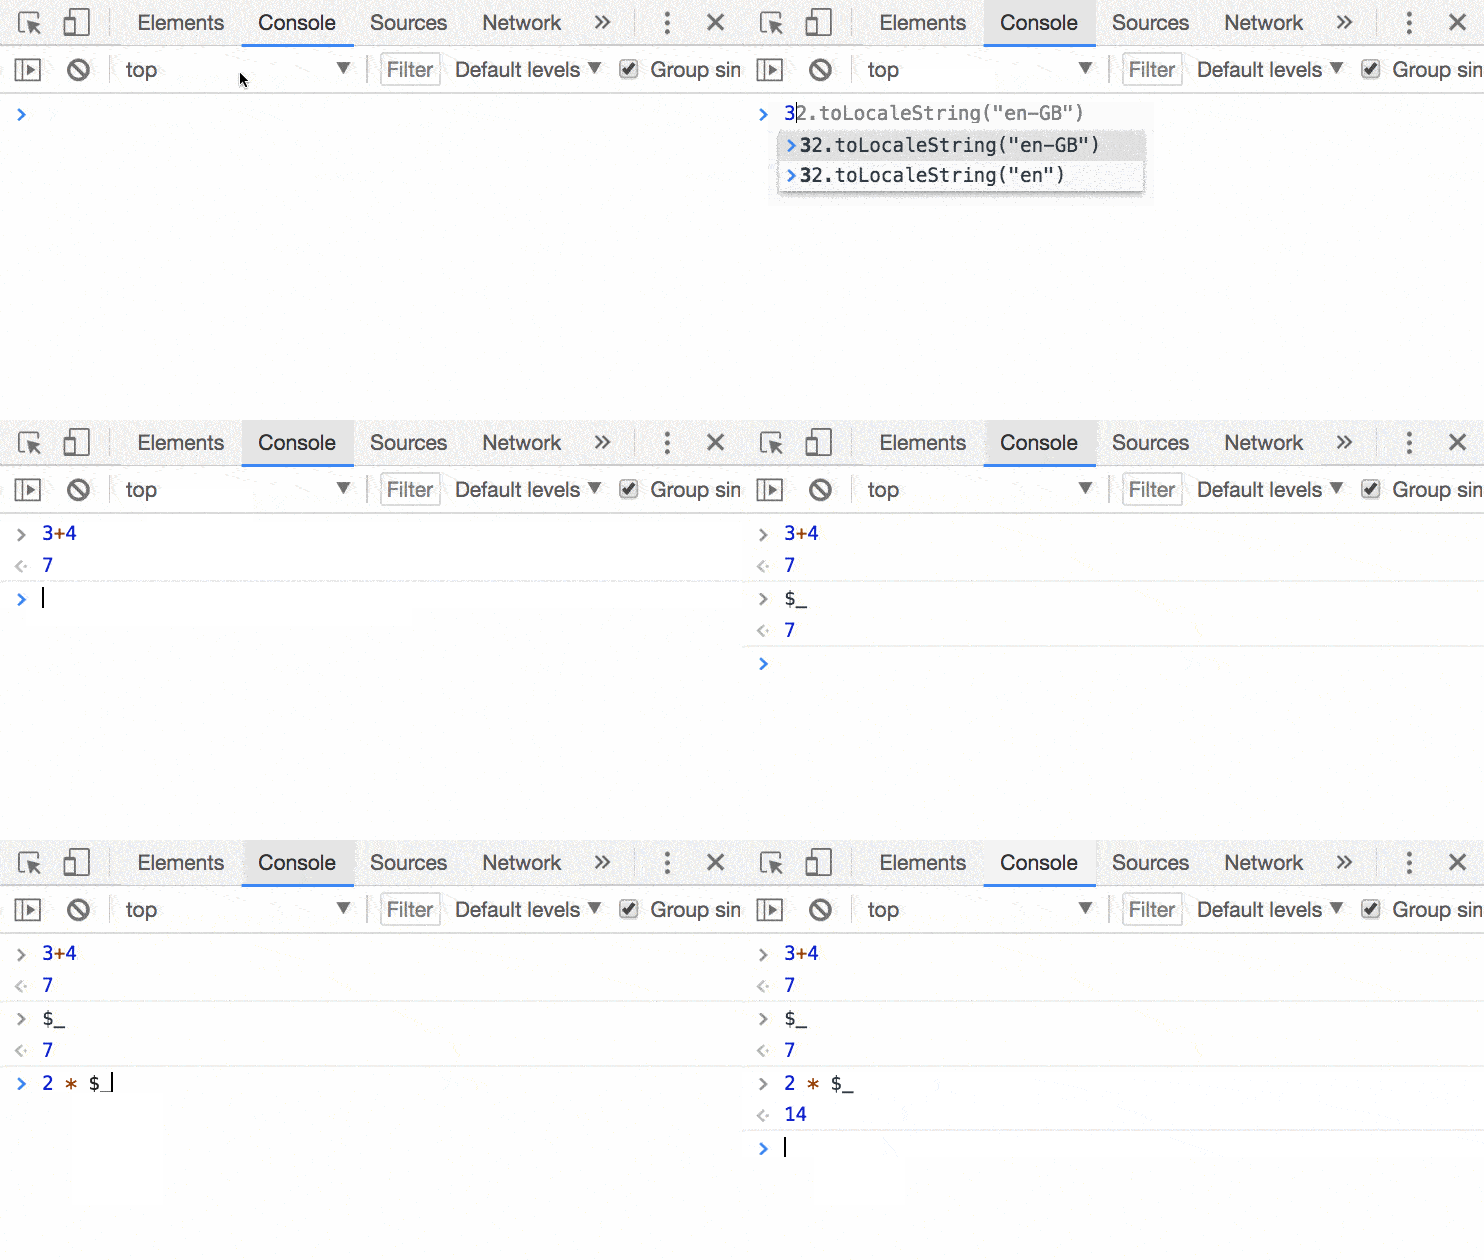
3. Use the value of the last operation in the Console
Use $_ to reference the return value of the previous operation executed in the Console
4. Add CSS and edit the element state
In the Elements panel there are two super useful buttons.
The first lets you add a new CSS property with any selector you want, but pre-filling the currently selected element:
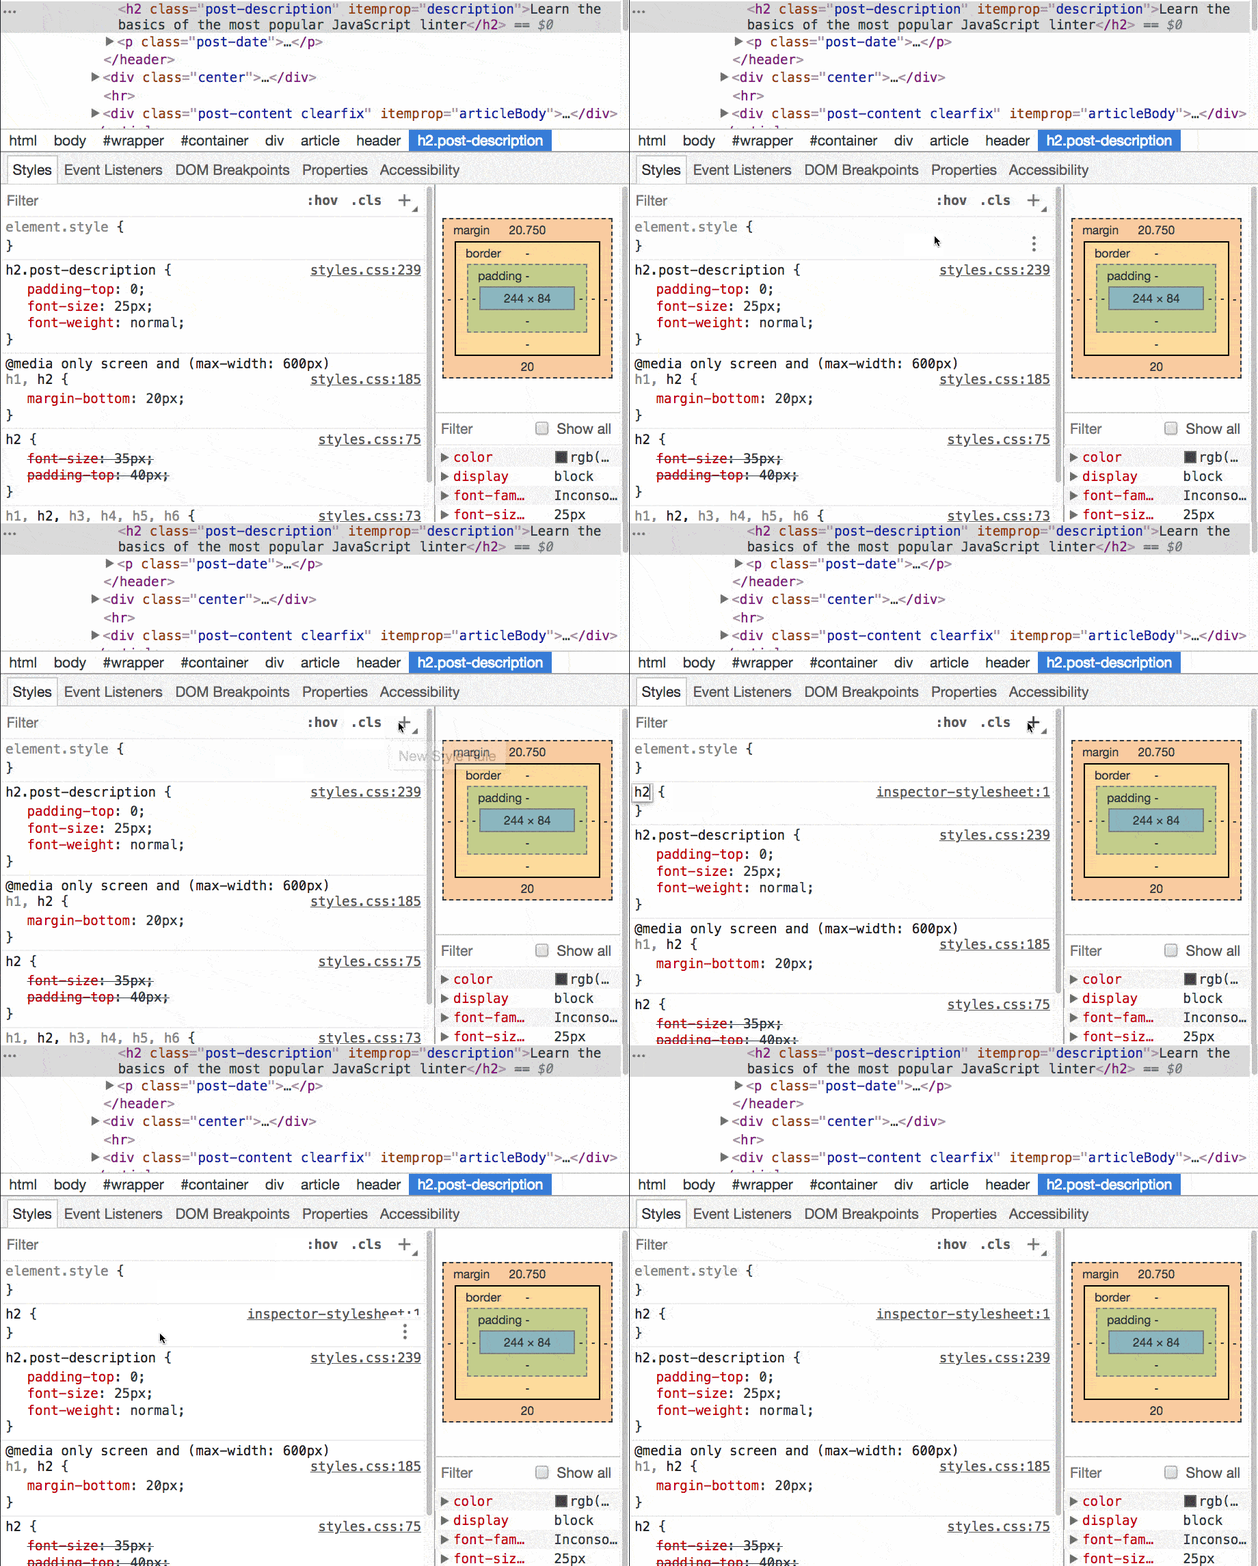
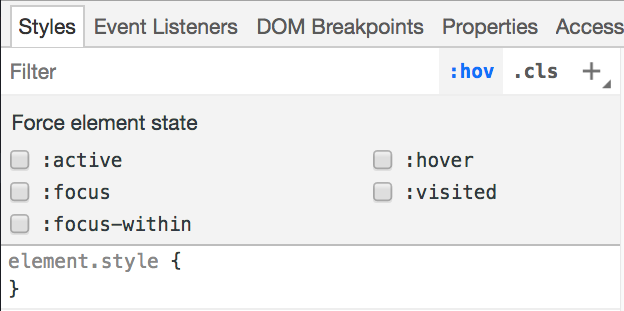
The second one lets you trigger a state for the selected element, so you can see the styles applied when it’s active, hovered, or on focus.
5. Save to file the modified CSS
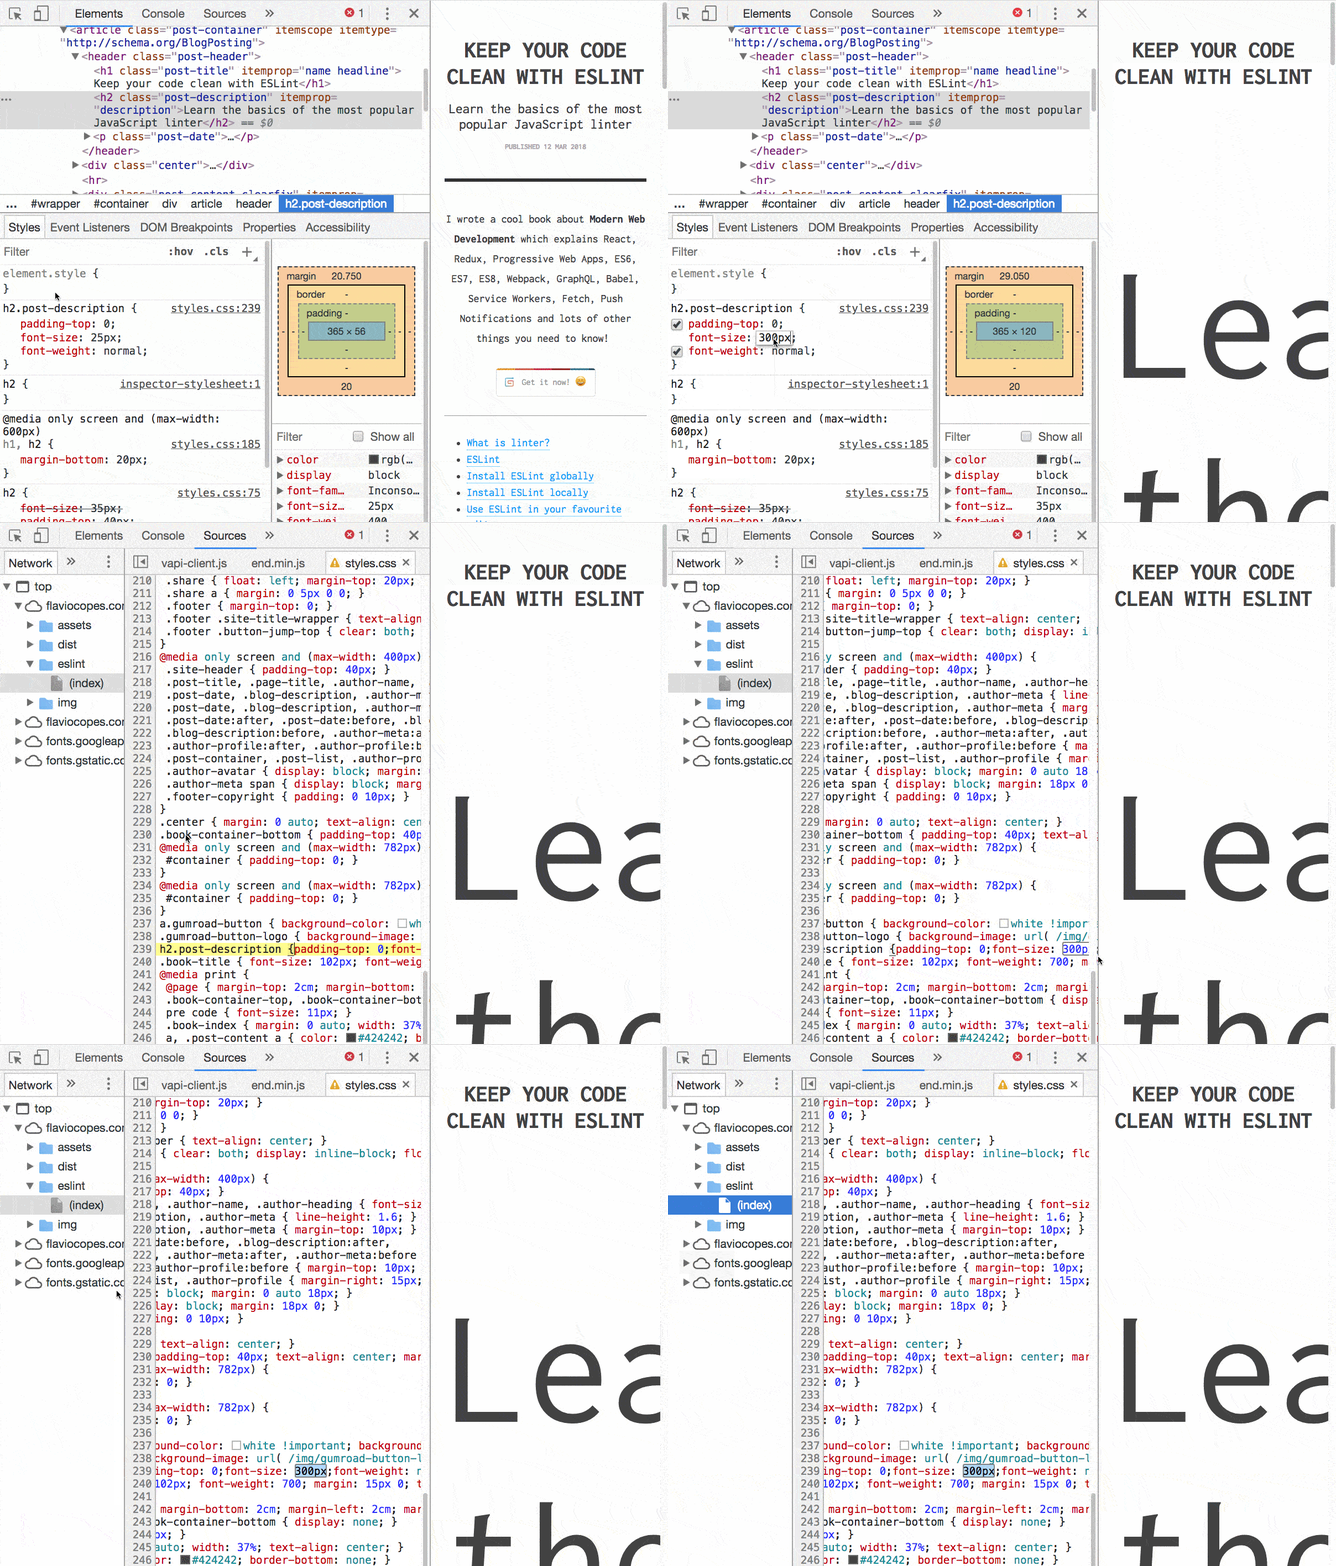
Click the name of the CSS file that you edited. The inspector opens it into the Sources pane, and from there you can save it with the live edits you applied.
This trick does not work for new selectors added using +, or into the element.style properties, but only for modified, existing ones.
6. Screenshot a single element
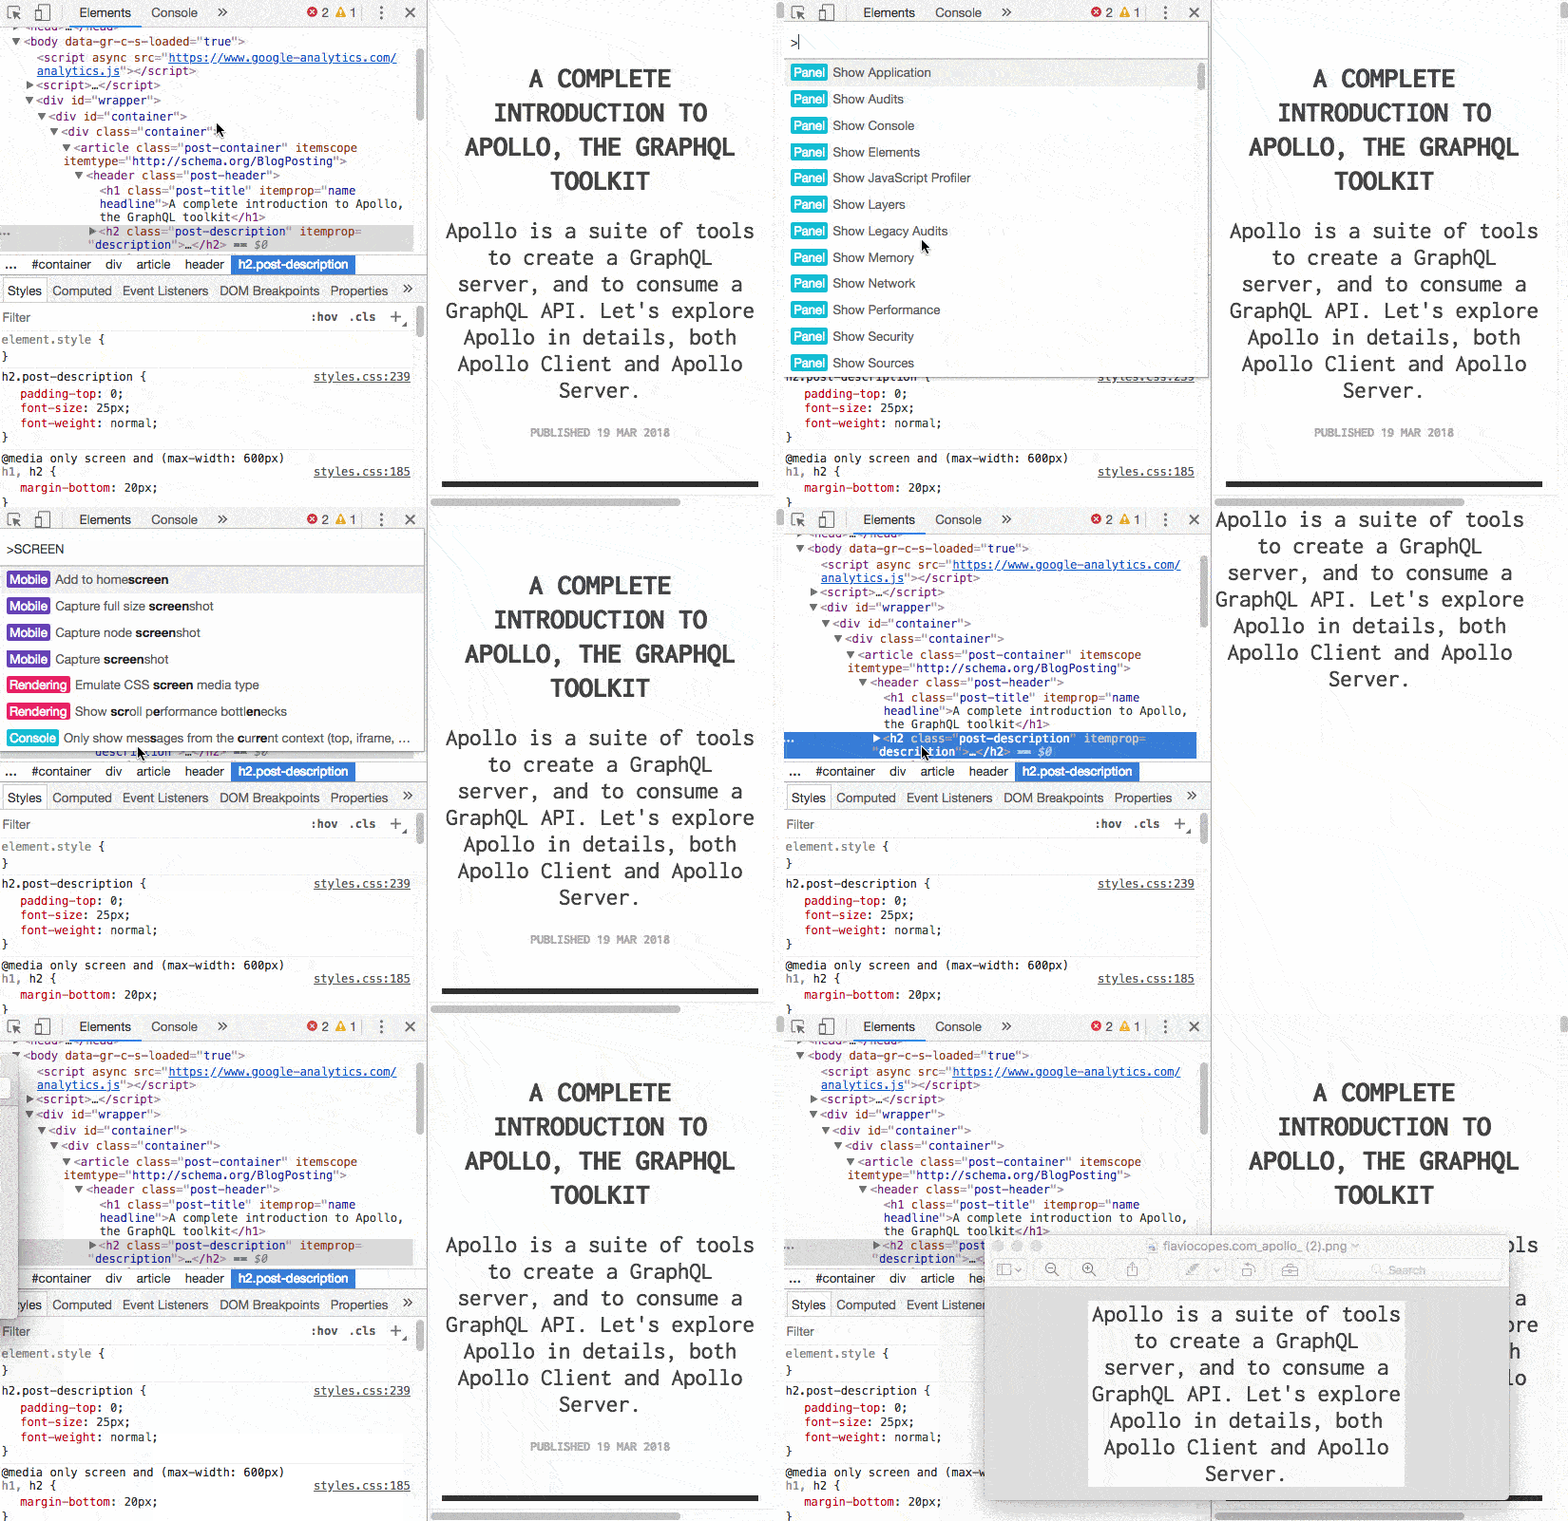
Select an element and press cmd-shift-p (or ctrl-shift-p in Windows) to open the Command Menu, and select Capture node screenshot
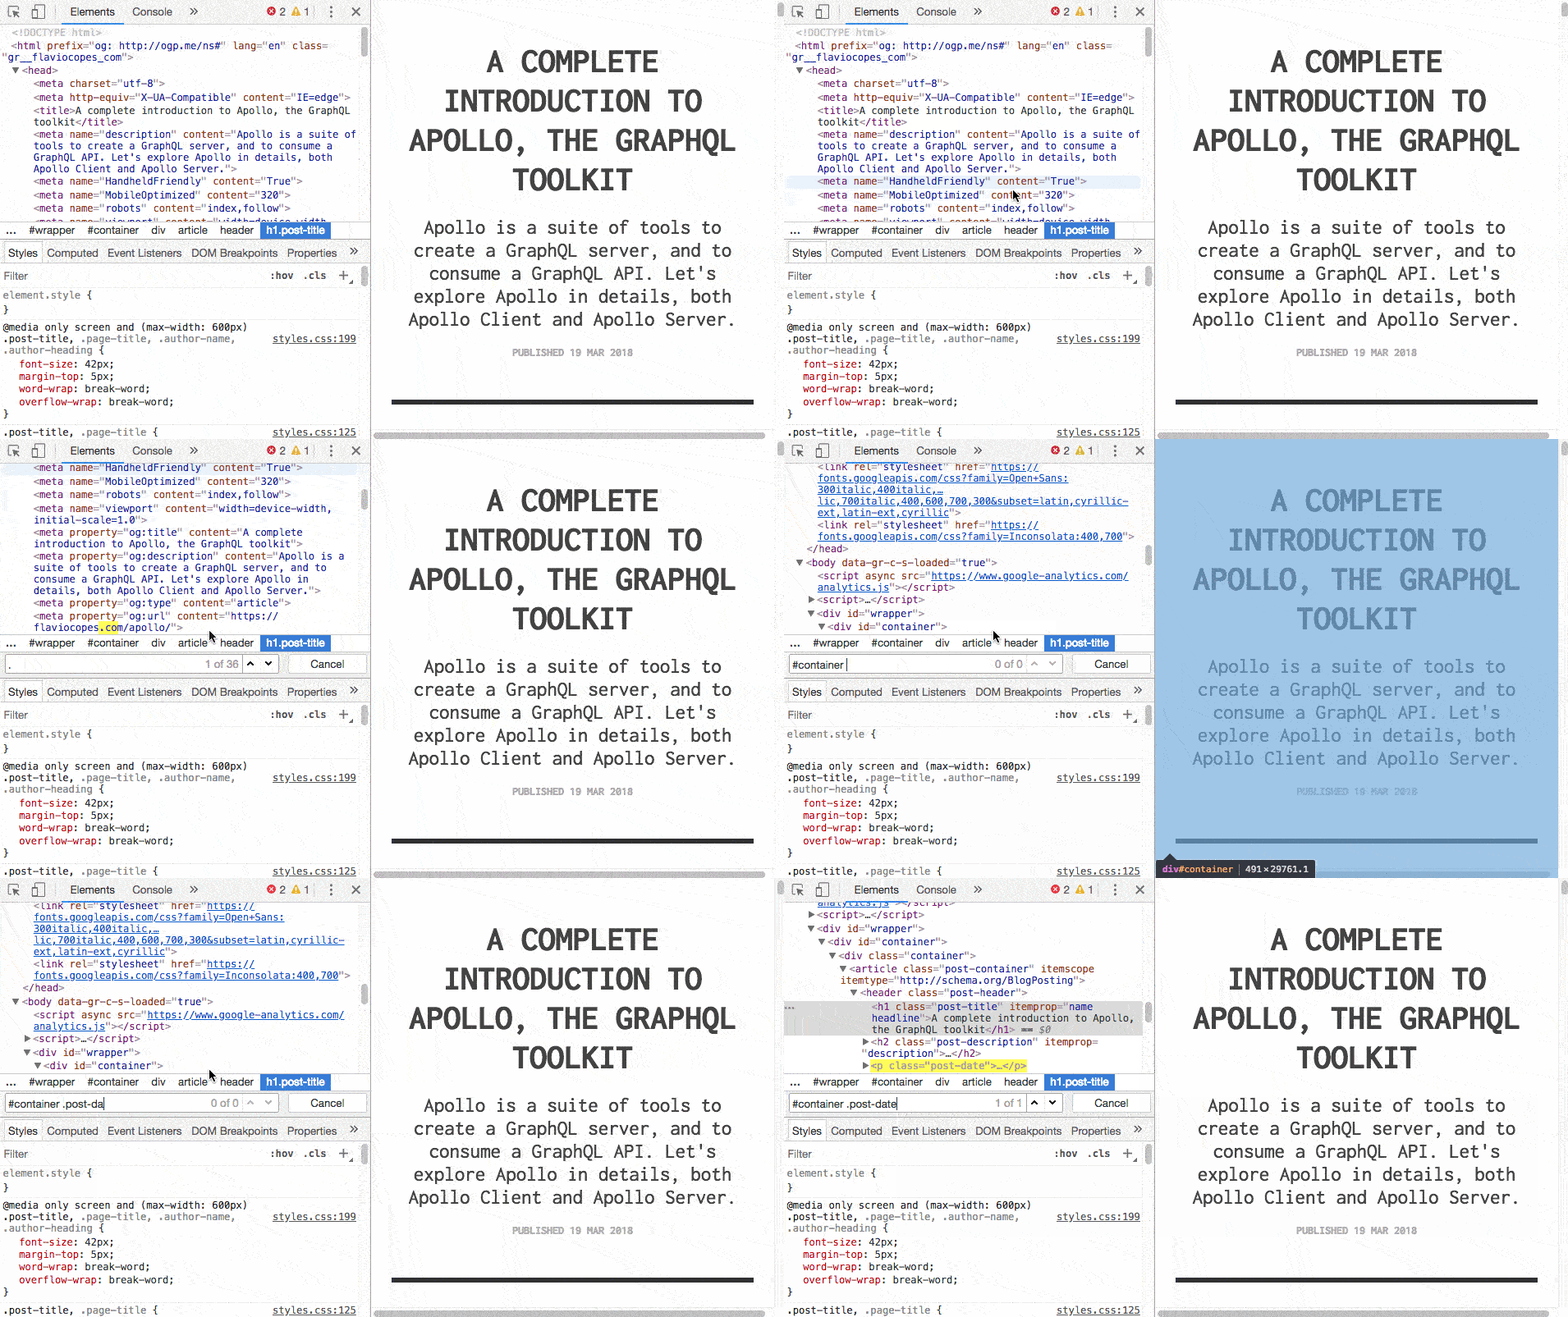
7. Find an element using CSS selectors
Pressing cmd-f (ctrl-f in Windows) opens the search box in the Elements panel.
You can type any string in there to match the source code, or you can also use CSS selectors to have Chrome generate an image for you:
8. Shift-enter in the Console
To write commands that span over multiple lines in the Console, press shift-enter.
Once you’re ready, press enter at the end of the script to execute it:
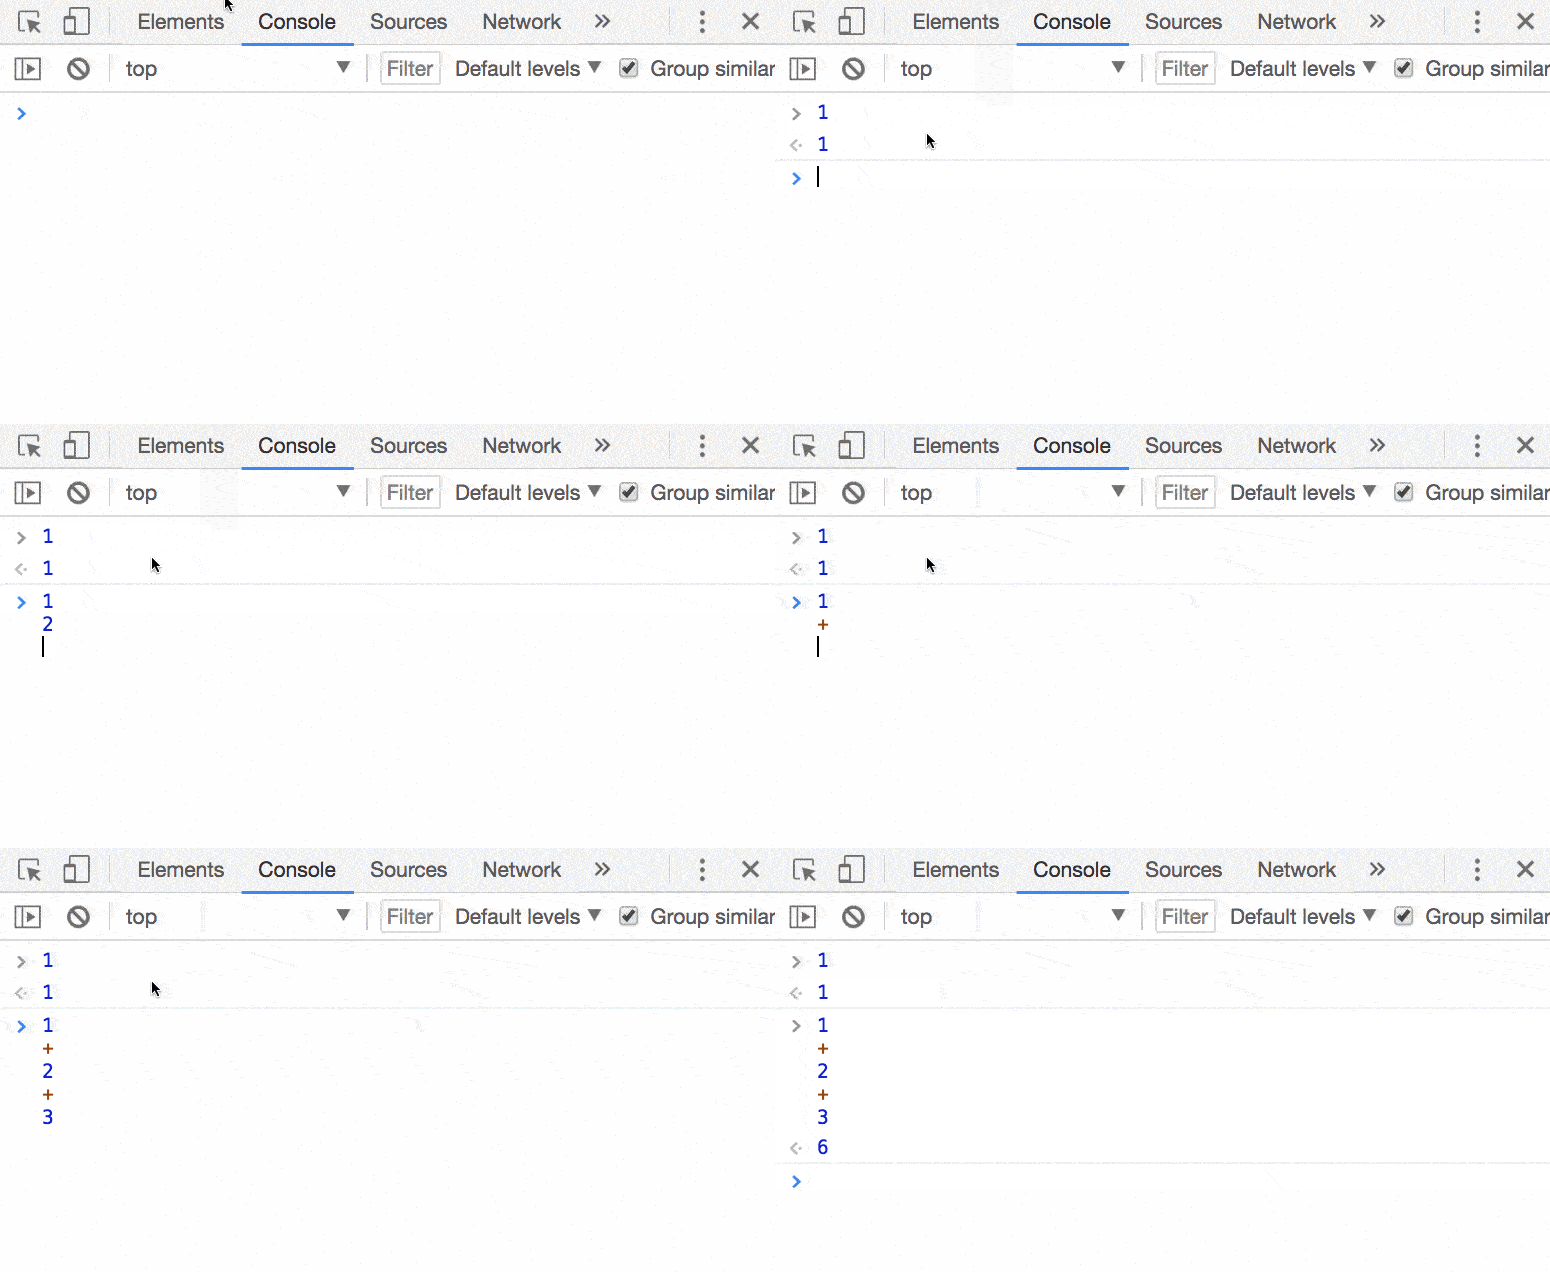
You can clear the console using the Clear button on the top-left of the console, or by pressing ctrl-l or cmd-k.
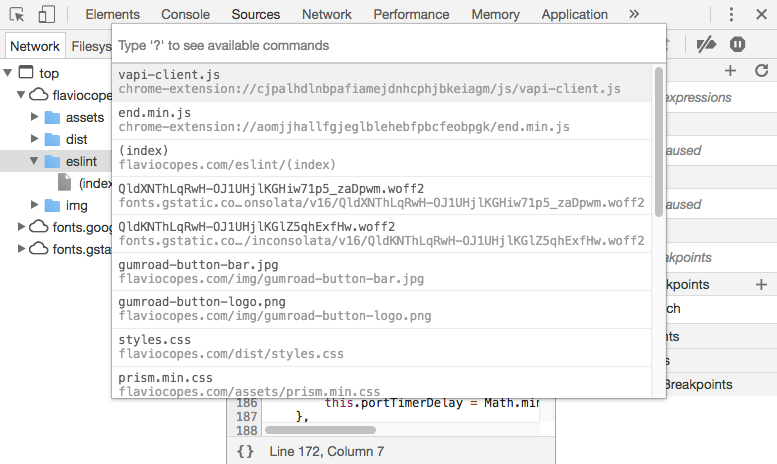
9. Go to…
In the Sources panel:
cmd-o(ctrl-oin Windows), shows all the files loaded by your page.cmd-shift-o(ctrl-shift-oin Windows) shows the symbols (properties, functions, classes) in the current file.ctrl-ggoes to a specific line.
10. Watch Expression
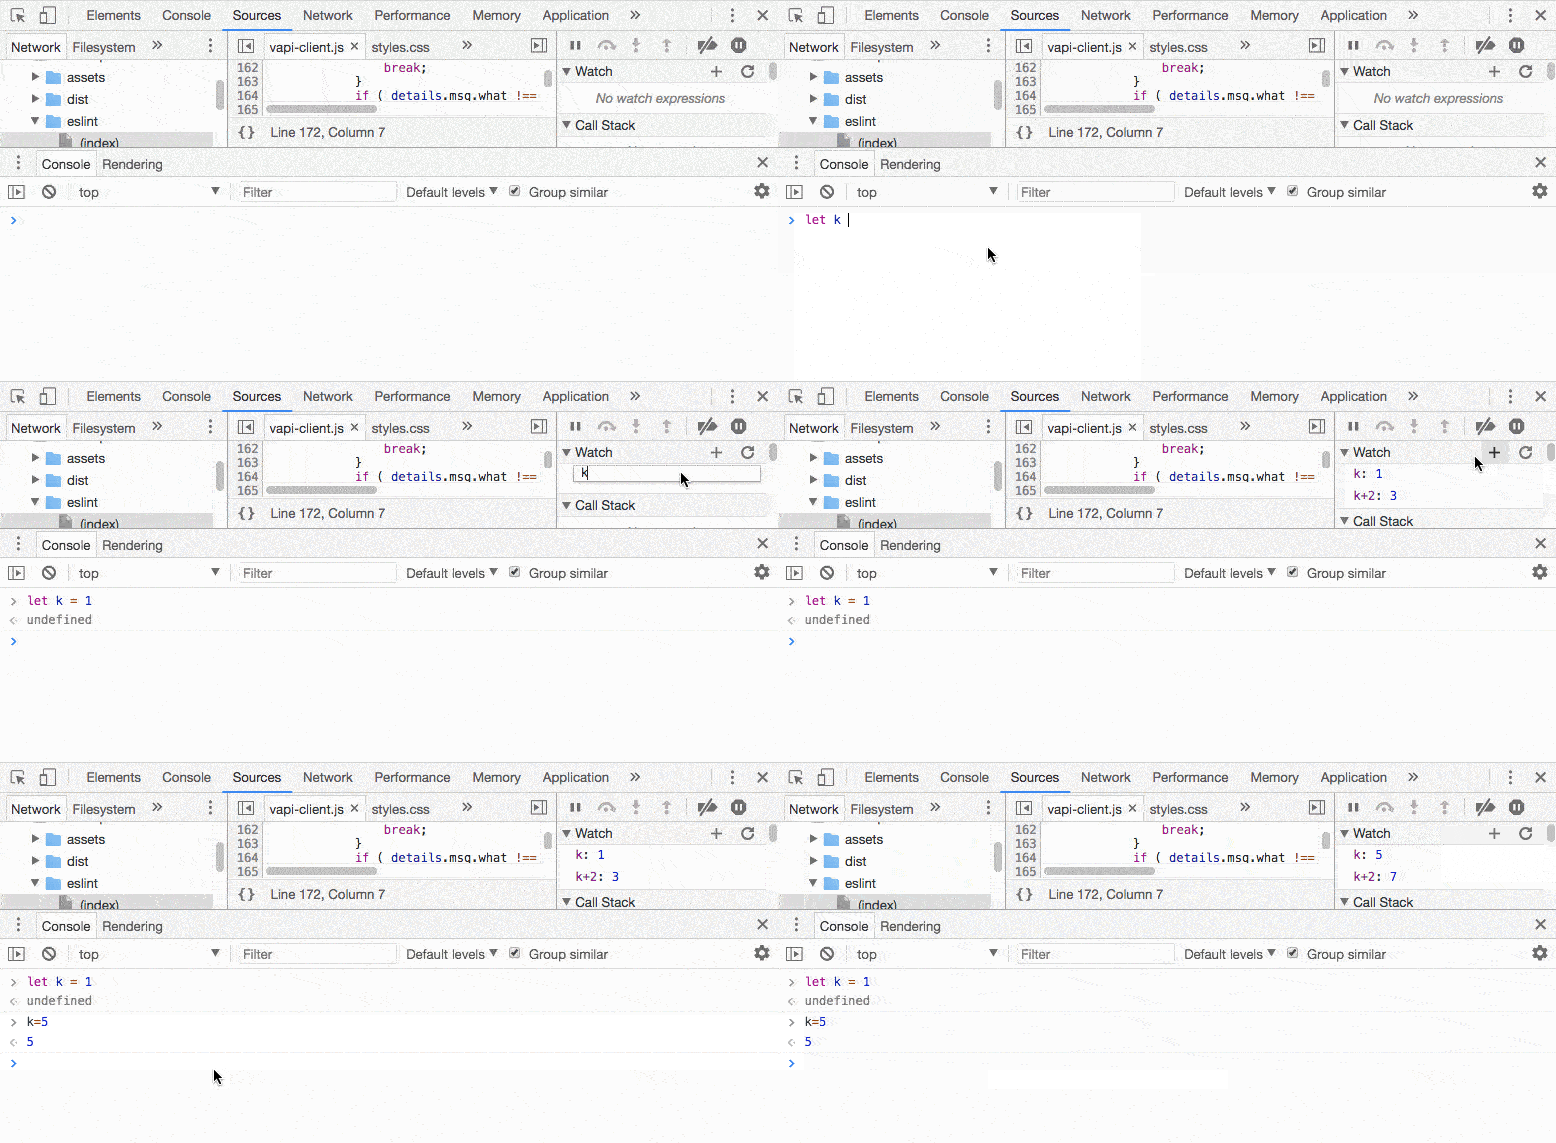
Instead of writing again and again a variable name or an expression you are going to check a lot during a debug session, add it to the Watch Expression list.
11. XHR/Fetch debugging
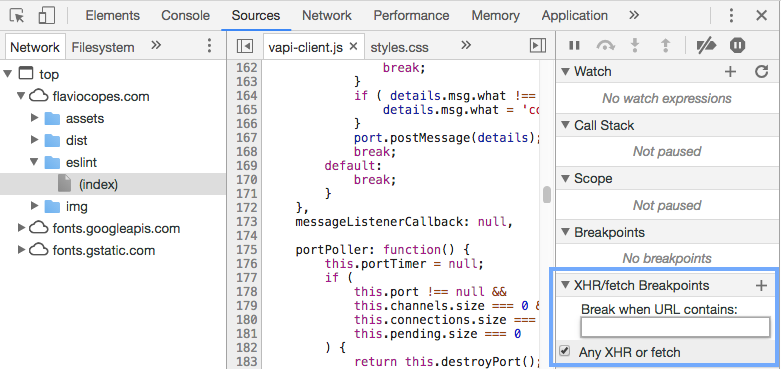
From the debugger open the XHR/Fetch Breakpoints panel.
You can set it to break any time an XHR/Fetch call is sent, or just on specific ones:
12. Debug on DOM modifications
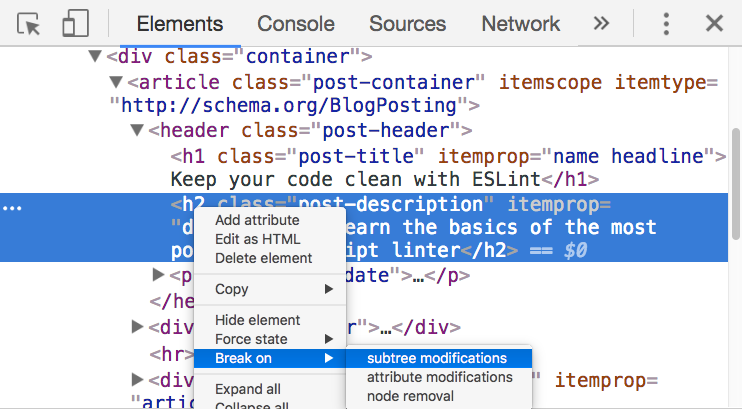
Right-click an element and enable Break on Subtree Modifications. Whenever a script traverses that element’s children and modifies them, the debugger stops automatically to let you inspect what’s happening.
Learn Vue.js with me! ??
I’m going to learn Vue.js full-time for 2 months, and I’ll create a resource for you to learn it quickly as well, with tutorials and projects, working examples and screencasts.

I will send you the free content I create ??? and I will keep you up to date with the course and offer you a big discount when the course is released. Stay in the loop, sign up here: https://flaviocopes.com/course/vue/ ?