Creating interactive infographics with plain Javascript (Part-one)
Introduction
Today’s browsers let us connect information in ways never seen before. Infographics is one such area. As a pictogram, it is an excellent visualisation tool. As an interactive webpage, you can achieve a new level of engagement with just a little bit of coding.
Many open-source libraries render fantastic infographics. Our favourites are D3, and vis.js. However, there are other times when we needed features that aren’t available from public libraries.
Objective
Let’s build an interactive infographic with plain Javascript.
Case Study
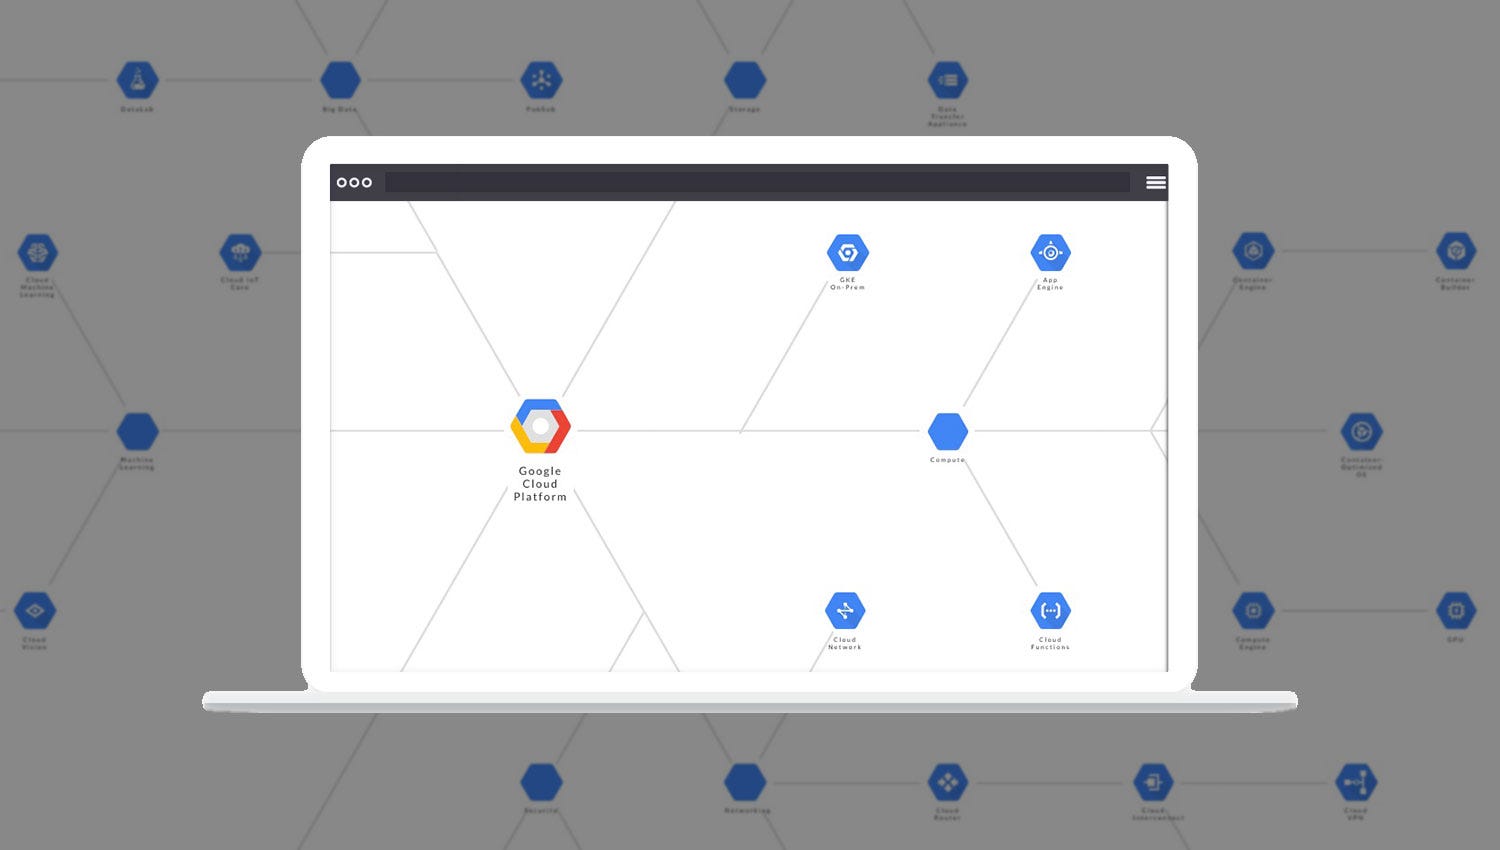
The Google Cloud Platform (GCP) is like a candy store to a web developer. Its product categories are more than fingers can count and each interconnects in different ways to solve complex problems.
If we harness the power of a modern browser to showcase the benefits of GCP products, how would the UI look like? Is it possible to use basic Javascript techniques to produce extraordinary results?
Design approach
Our design approach is based on the idea of using a consistent and persistent User Interface (UI) to tell an engaging story. Let’s rethink design in two areas:
- Information architecture. Can we treat information as a continuous path and not pieces of jig-saw puzzles stitched through repetitive page loads?
- User Interface (UI). Can we present information through an interactive and consistent UI that works a looking glass?

- Brevity. We want to create a customisable UI with as little code as possible.
- Simplicity. We want to use out-of-the-box browser features and not third-party libraries. That means using only Plain Javascript.
- Reusability. We want to separate the view from the model so that it is easier to adapt our project to other use-cases.
Getting started — the basic building blocks
Let’s introduce the notion of nodes and links as the basic building blocks of our design workflow.
Nodes are the start and end points. For example, a bus stop can be called a node. A bus route from one node to another can be called a link. A group of related nodes and links can be called a branch.
Node elements. We can use an HTML element and a unique id to describe a node. For example, node11 would be node #1 of branch #1. Similarly, node12 would be node #2 of branch #1. In the above diagram, that would be circle “1” and “2”. The bus route #1 (i.e. branch #1) would connect circle “1” and “2”, as well as other circles (i.e. 2a,3,3a,3b).
Let’s use the style attribute to describe the unique position, shape and behaviour of each element. You can use any HTML, CSS, icons or images to represent a node or link. The circular nodes in our videos are simply div tags with a CSS border-radius.
<div id=”node11" style=”…”>1–1 Occupation Name</div>
<div id=”node12" style=”…”>1–2 Occupation Name</div>
Link elements. Links connects nodes. For example, link1112 connects node11 and node12.
<div style=”...” id=”link1112"></div>
Tip: Use an image overlay to guide your CSS positioning of the HTML elements.
Concept aside — how interaction works on a webpage
The nodes and links we’ve discussed are essentially DOM elements at browser runtime. The DOM, or Document Object Model, is a tree-like data structure for representing HTML elements and mapping content onto a physical display.
Conversely, we can also interact with any display elements by manipulating the DOM. In our project, we would like these nodes and links to respond to a specific user action such as a mouseover event.
document.addEventListener( "mouseover", myCustomFunction );
mouseoverdetects a mouse cursor hovering over a particular DOM document such as a button.- Upon detection, it’ll call
myCustomFunctionto do something (e.g. spring an animation sequence or retrieve information from a database).
We’ll use this Javascript API to detect user actions and trigger a whole range of functionalities to create interactive web pages.
Creating workflow shortcuts
Let’s bind the node and link elements to its event listeners within a loop in two steps:
Step one. Assign the model (data).
Store your HTML element’s unique id values as an item[] array.
var item = [
 ‘11’,’12',’1112',
 ‘21’,’22',’2122',
 ...
 ];
Each value in the item[] array will correspond to the unique id value of each node or link (e.g. 11 refers to node11; 1112 refers to link1112.). You can think of item[] as a master registry.
Next set up legend[] to hold an array of objects. Each object is a dataset that will correspond to a specific user action.
var legend = {
 'item11' : { "node" : ['11'], "links" : [] },
 'item12' : { "node" : ['11','12'], "links" : ['1112'], },
 ...
}
- When a mouse cursor hovers over
node11, the objectitem11will callnode11for CSS targeting. - Similarly, when a cursor hovers over node12, the object
item12callsnode11,node12, andlink1112for CSS targeting. itemis just a prefix label. Use your naming convention.
Let’s take a moment to consider the implication of the above schema. Not only have we created a system to store content, we have also created a graph relationship to describe data connections.
We’ve reduced tons of code; sped up the design workflow; and separated the view from the model (data). Let’s move on to build the view engine.
Tip: For dynamic content management, consider encoding your dataset as JSON and access them via a database. Also, use any tools to edit your dataset and HTML layouts.
Step two. Loop through each HTML element to associate event listeners programmatically.
while (item[i]) {
   itemElement[i] = "node".concat(item[i]);
   itemElementName[i] = document.getElementById( itemElement[i] );
   itemElementName[i].addEventListener( "mouseover", mouseOver );
   itemElementName[i].addEventListener( "mouseout", mouseOut );
   ...
   i++;
}
whileiterates through the id values of each DOM element registered atitem[].“item”.concat(item[i])reattaches any custom prefixes you may have (i.e. “node”) to match the actual id values.itemElementName[i] = document.getElementById( item[i] )builds an array of DOM references.- “
mouseover” and “mouseout” binds each DOM element to a user action.
Tip # 1: Mobile and touch devices have its own set of event listeners such as touchstart and touchmove. Use them to create responsive designs.
Tip #2: Use the “passive” parameter on your touch or wheel event listeners to improve browser performance like so:
document.addEventListener('touchstart', onTouchStart, {passive: true});Customising interactive behaviours with CSS
We can create custom functions mouseOver and mouseOut to apply CSS effects:
function mouseOver(event) {
   for (var i in legend[this.id]["node"]) {
      var currKey = "node".concat(legend[this.id]["node"][i]);
      document.getElementById(currKey).style.background = "grey";
      ...
   }
   for (var i in legend[this.id]["link"]) {
      var currKey = "link".concat(legend[this.id]["link"][i]);
      document.getElementById(currKey).style.border = "1px solid
      #000";
      ...
   }
}
- Use an event listener
mouseoverto bind a DOM element to your custom functionmouseOver. This function takes in theeventparameter (provided by the browser) to give the activethis.idvalue. legend[this.id][“node”]identifies the dataset for applying CSS targeting.forloops through the collectionlegend[].
In our example, the mouseOver function turns the background colour of the targeted node(s) grey.
Use the same idea on link elements. In our example, we changed the colour of links1112 from grey to solid black when a mouse pointer hovers over node12 (node11 and node12 also turn grey).
Next, “reset” the CSS behaviour as soon as the cursor exits the current DOM element (see bold).
function mouseOut() {
   for (var i in legend[this.id]["node"]) {
      var currKey = "node".concat(legend[this.id]["node"][i]);
      document.getElementById(currKey).style.background = "unset";
      ...
   }
   for (var i in legend[this.id]["link"]) {
      ...
   }
}
Unlimited scaling with SVG
Our GCP infographics use SVG extensively to support high-def resolution for a zooming feature that’ll be implemented in the next part of our discussion.
To change the HTML/CSS circle 1, or node11, into a hexagonal SVG shape, simply wrap your SVG content within an HTML container (see bold).
<div id=”node11" style=”display:flex; align-items:center;">
    <svg>
        <path d="...some paths"/>
    </svg>
    <div style="align-items:center; width:100%;">
        My Text Label
    </div>
</div>
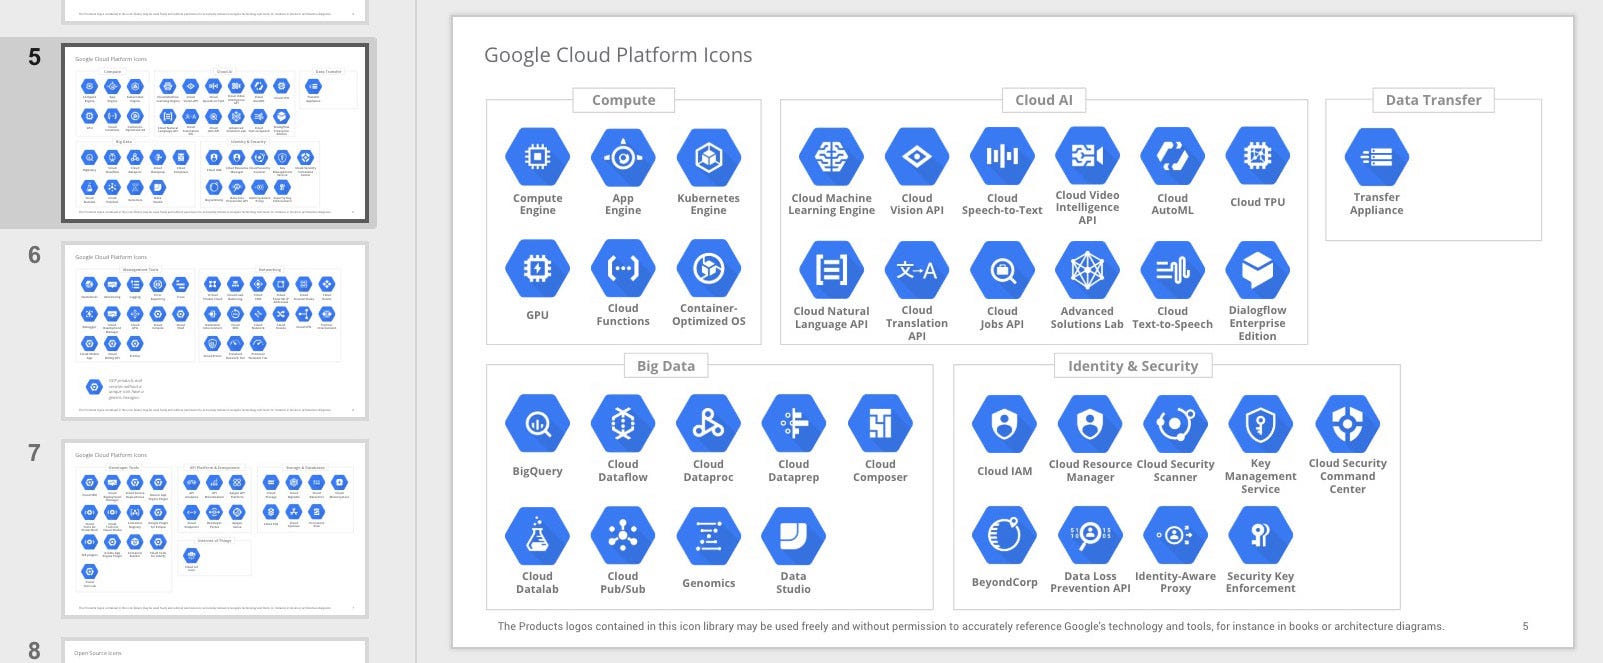
id=”node11"references the same node. Instead of rendering an HTML circle shape, it now contains SVG data.display:flexandalign-items:centeruses Flexbox, now supported on all major browsers, to automatically align our SVG and text content.<svg>...</svg>contains the SVG data that describes our zoomable icon. Visit the official GCP icon library to download the complete icon pack.
Populating content
We added SVG to the model. Let’s see how a sample layout with GCP content looks so far.
- Use
scale3deffect to create impactful highlighting effects. - Use
dashedto illustrate different relationships.
Next Steps
We’ve devised a schema and a view engine as a foundation for our design workflow.
In the next part, we’ll add several navigation capabilities to the UI.
Side note
This story is a 5-part series on how to create interactive infographics from scratch. We’ve handpicked what’s important so that you can get to the essential parts quickly and apply them in your projects. It does help that you have some knowledge of CSS and HTML. Non-relevant code blocks are glossed over.
All video illustrations are screen captured on a Chrome browser. While our examples are based on GCP products, you can find many similar applications such as org charts, ecosystems, subway maps, flowcharts, progression trees, network topologies, and more.
Many thanks to Chuck Erickson and the Google Team for the wonderful GCP solutions icon and diagram pack.
SOURCE: https://hackernoon.com/how-to-build-an-interactive-infographic-from-scratch-94128678c83b
WRITE BY