
Building interactive sites can involve sending JavaScript to your users. Often, too much of it. Have you been on a mobile page that looked like it had loaded only to tap on a link or tried to scroll and nothing happens?
Byte-for-byte, JavaScript is still the most expensive resource we send to mobile phones, because it can delay interactivity in large ways.

Today we’ll cover some strategies you can use to deliver JavaScript efficiently while still giving users a valuable experience.
tl;dr:
- To stay fast, only load JavaScript needed for the current page.Prioritize what a user will need and lazy-load the rest with code-splitting. This gives you the best chance at loading and getting interactive fast. Stacks with route-based code-splitting by default are game-changers.
- Embrace performance budgets and learn to live within them. For mobile, aim for a JS budget of < 170KB minified/compressed. Uncompressed this is still ~0.7MB of code. Budgets are critical to success, however, they can’t magically fix perf in isolation. Team culture, structure and enforcement matter. Building without a budget invites performance regressions and failure.
- Learn how to audit and trim your JavaScript bundles. There’s a high chance you’re shipping full-libraries when you only need a fraction, polyfills for browsers that don’t need them, or duplicate code.
- Every interaction is the start of a new ‘Time-to-Interactive’; consider optimizations in this context. Transmission size is critical for low-end mobile networks and JavaScript parse time for CPU-bound devices.
- If client-side JavaScript isn’t benefiting the user-experience, ask yourself if it’s really necessary. Maybe server-side-rendered HTML would actually be faster. Consider limiting the use of client-side frameworks to pages that absolutely require them. Server-rendering andclient-rendering are a disaster if done poorly.
The web is bloated by user “experience”
When users access your site you’re probably sending down a lot of files, many of which are scripts. From a web browsers’ perspective this looks a little bit like this:

As much as I love JavaScript, it’s always the most expensive part of your site. I’d like to explain why this can be a major issue.

The median webpage today currently ships about 350 KB of minified and compressed JavaScript. Uncompressed, that bloats up to over 1MB of script a browser needs to process.
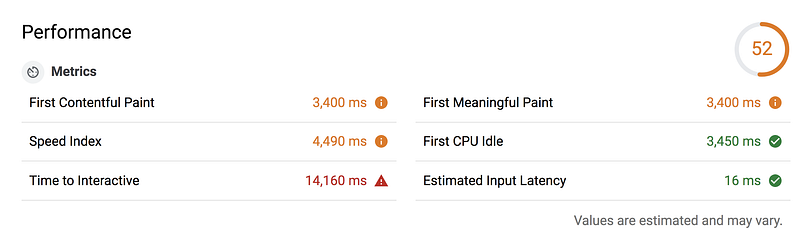
Note: Unsure if your JavaScript bundles are delaying how quickly users interact with your site? Check out Lighthouse.
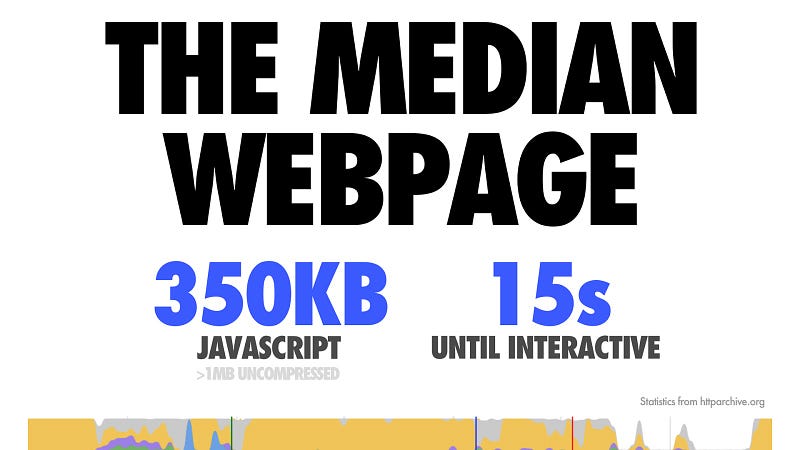
Experiences that ship down this much JavaScript take more than 14+ seconds to load and get interactive on mobile devices.
A large factor of this is how long it takes to download code on a mobile network and then process it on a mobile CPU.
Let’s look at mobile networks.
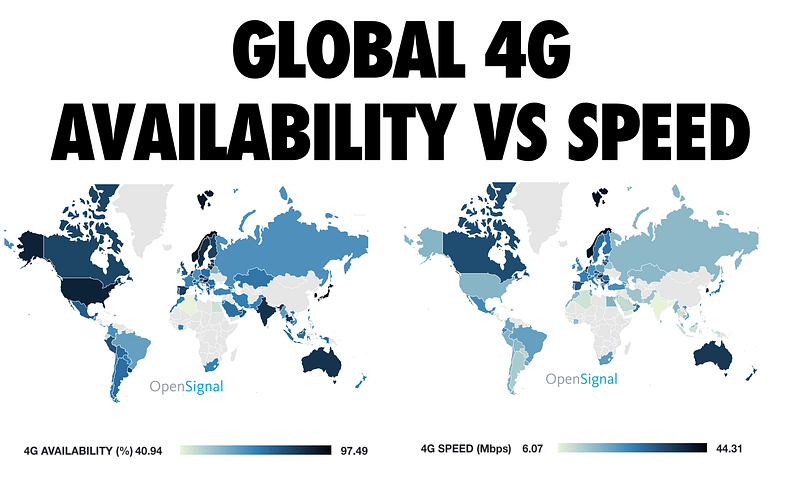
This chart from OpenSignal shows how consistently 4G networks are globally available and the average connection speed users in each country experience. As we can see, many countries still experience lower connection speeds than we may think.
Not only can that 350 KB of script for a median website from earlier take a while to download, the reality is if we look at popular sites, they actually ship down a lot more script than this:
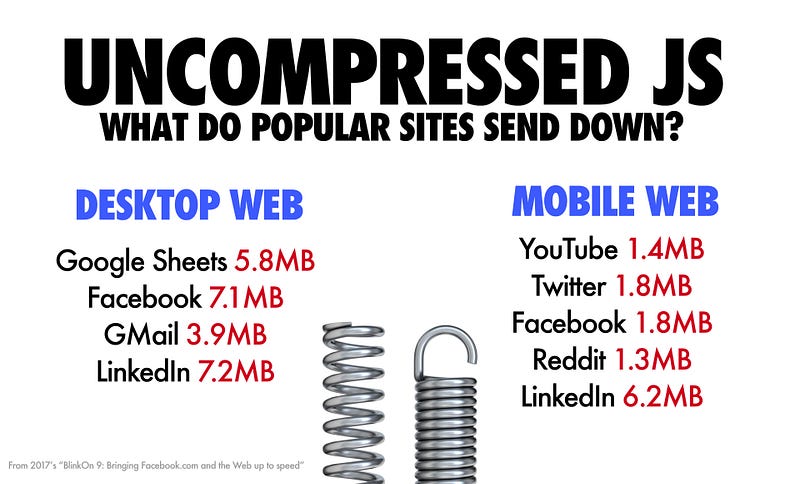
We’re hitting this ceiling across both desktop and mobile web, where sites are sometimes shipping multiple megabytes-worth of code that a browser then needs to process. The question to ask is, can you afford this much JavaScript?
JavaScript has a cost

Note: If you’re sending too much script, consider code-splitting to break up bundles or reducing JS payloads using tree-shaking.
Sites today will often send the following in their JS bundles:
- A client-side framework or UI library
- A state management solution (e.g. Redux)
- Polyfills (often for modern browsers that don’t need them)
- Full libraries vs. only what they use (e.g. all of lodash, Moment + locales)
- A suite of UI components (buttons, headers, sidebars etc.)
This code adds up. The more there is, the longer it will take for a page to load.
Loading a web page is like a film strip that has three key moments.
There’s: Is it happening? Is it useful? And, is it usable?
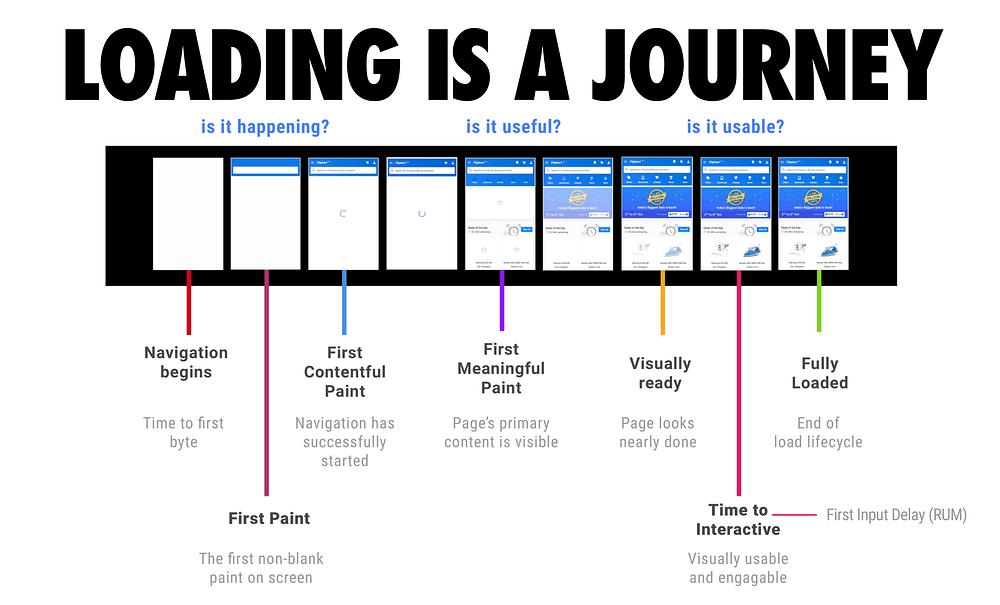
Is it happening is the moment you’re able to deliver some content to the screen. (has the navigation started? has the server started responding?)
Is it useful is the moment when you’ve painted text or content that allows the user to derive value from the experience and engage with it.
And then is it usable is the moment when a user can start meaningfully interacting with the experience and have something happen.
I mentioned this term “‘interactive” earlier, but what does that mean?
For a page to be interactive, it must be capable of responding quickly to user input. A small JavaScript payload can ensure this happens fast.
Whether a user clicks on a link, or scrolls through a page, they need to see that something is actually happening in response to their actions. An experience that can’t deliver on this will frustrate your users.
One place this commonly happens is when folks server-side render an experience, and then ship a bunch of JavaScript down afterward to “hydrate” the interface (attaching event handlers and extra behaviors).
When a browser runs many of the events you’re probably going to need, it’s likely going to do it on the same thread that handles user input. This thread is called the main thread.
Loading too much JavaScript into the main thread (via <script>, etc) is the issue. Pulling JS into a Web Worker or caching via a Service Workerdoesn’t have the same negative Time-to-Interactive impact.
Avoid blocking the main thread as much as possible. For more, see “Why web developers need to care about interactivity”
We’re seeing teams we partner with suffer JavaScript impacting interactivity across many types of sites.
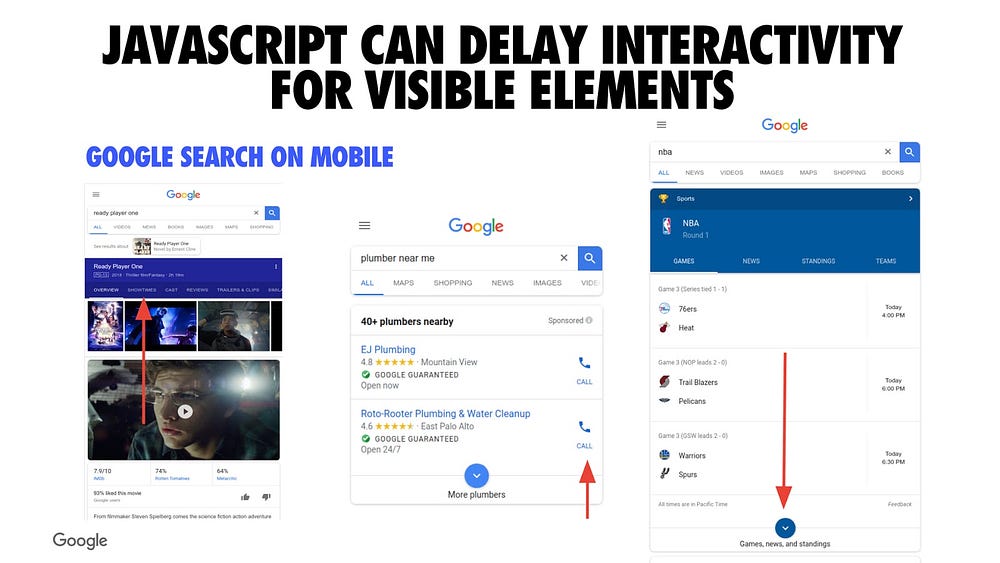
Too much (main thread) JavaScript can delay interactivity for visible elements. This can be a challenge for many companies.
Above are a few examples from Google Search where you could start tapping around the UI, but if a site is shipping too much JavaScript down, there could be a delay before something actually happens. This can leave the user feeling a bit frustrated. Ideally, we want all experiences to get interactive as soon as possible.
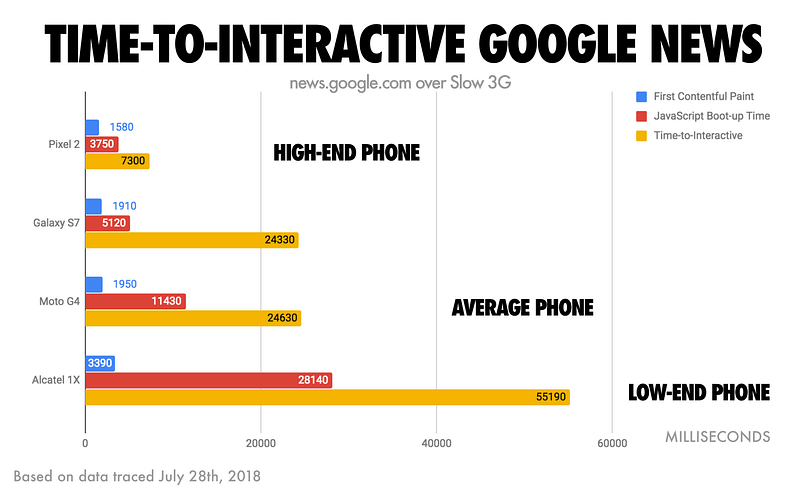
Measuring the Time-to-Interactive of Google News on mobile, we observe large variance between a high-end getting interactive in ~7s vs. a low-end device getting interactive in 55s. So, what is a good target for interactivity?

When it comes to Time to Interactive, we feel your baseline should be getting interactive in under five seconds on a slow 3G connection on a median mobile device. “But, my users are all on fast networks and high-end phones!” …are they? You may be on “fast” coffee-shop WiFi but effectively only getting 2G or 3G speeds. Variability matters.
Who has shipped less JavaScript and reduced their Time-to-Interactive?
- Pinterest reduced their JavaScript bundles from 2.5MB to < 200KB and Time-to-Interactive reduced from 23s to 5.6s. Revenue went up 44%, sign-ups are up 753%, weekly active users on mobile web are up 103%.
- AutoTrader reduced their JavaScript bundle sizes by 56% and reduced Time-to-Interactive for their pages by ~50%.
- Nikkei reduced their JavaScript bundle size by 43% and Time-to-Interactive improved by 14s.
Let’s design for a more resilient mobile web that doesn’t rely as heavily on large JavaScript payloads.
Interactivity impacts a lot of things. It can be impacted by a person loading your website on a mobile data plan, or coffee shop WiFi, or just them being on the go with intermittent connectivity.

When this happens, and you have a lot of JavaScript that needs to be processed, users can end up waiting for the site to actually render anything. Or, if something does render, they can be waiting a long time before they can interact with anything on the page. Ideally, shipping less JavaScript would alleviate these issues.
Why is JavaScript so expensive?
To explain how JavaScript can have such a large cost, I’d like to walk you through what happens when you send content to a browser. A user types a URL into the browser’s address bar:

A request is sent to a server which then returns some markup. The browser then parses that markup and discovers the necessary CSS, JavaScript, and images. Then, the browser has to fetch and process all of those resources.
The above scenario is an accurate depiction of what happens in Chrome when it processes everything that you send down (yes, it’s a giant emoji factory).
One of the challenges here is that JavaScript ends up being a bottleneck. Ideally, we want to be able to paint pixels quickly, and then have the page interactive. But if JavaScript is a bottleneck, you can end up just looking at something that you can’t actually interact with.
We want to prevent JavaScript from being a bottleneck to modern experiences.
One thing to keep in mind as an industry is that, if we want to be fast at JavaScript, we have to download it, parse it, compile it, and execute it quickly.
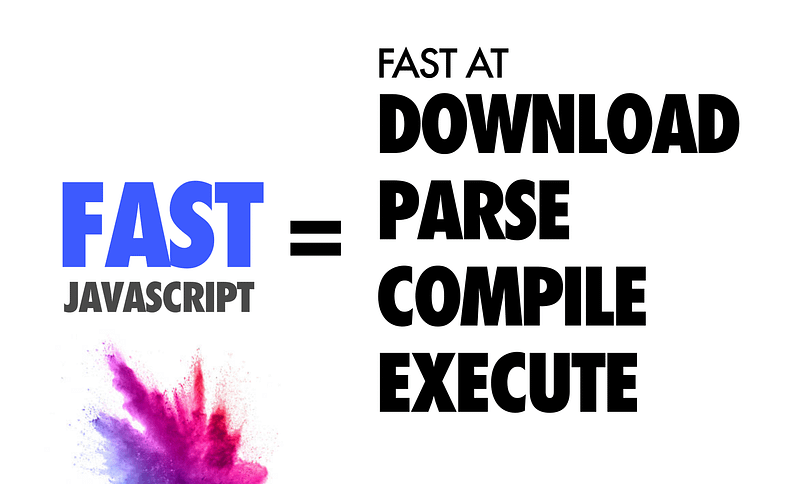
That means we have to be fast at the network transmission and the processing side of things for our scripts.
If you spend a long time parsing and compiling script in a JavaScript engine, that delays how soon a user can interact with your experience.
To provide some data about this, here’s a breakdown of where V8 (Chrome’s JavaScript engine) spends its time while it processes a page containing script:
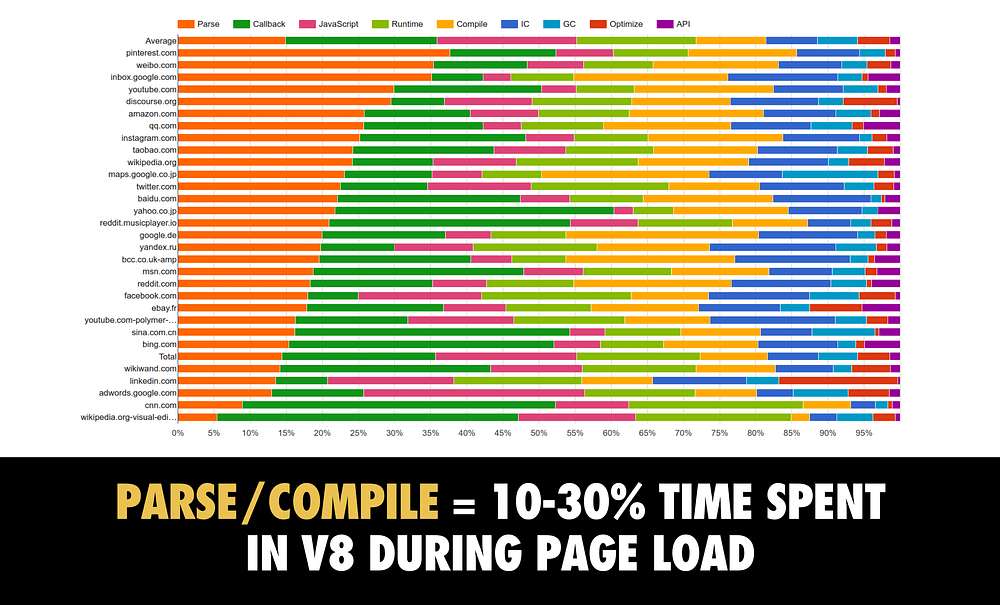
The orange represents all the time spent parsing JavaScript that popular sites are sending down. In yellow, is the time spent compiling. Together, these take anywhere up to 30% of the time it takes to process the JavaScript for your page — this is a real cost.
As of Chrome 66, V8 compiles code on a background thread, reducing compile time by up to 20%. But parse and compile are still very costly and it’s rare to see a large script actually execute in under 50ms, even if compiled off-thread.
Another thing to keep in mind with JavaScript is that all bytes are not equal. A 200 KB script and a 200 KB image have very different costs.
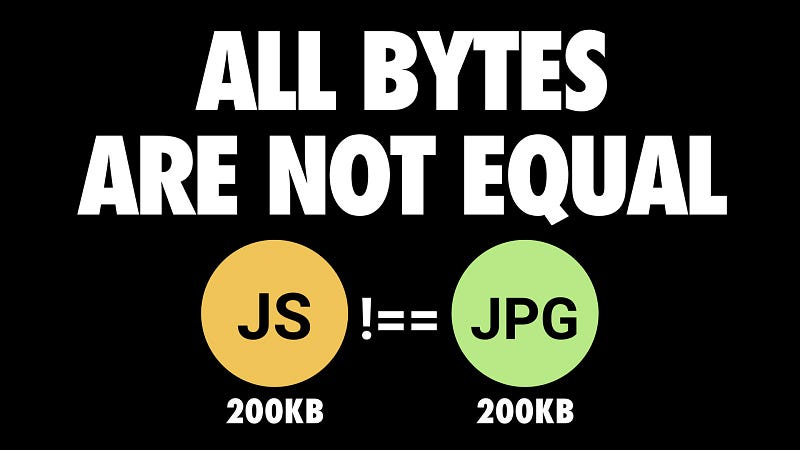
They might take the same amount of time to download, but when it comes to processing we’re dealing with very different costs.
A JPEG image needs to be decoded, rasterized, and painted on the screen. A JavaScript bundle needs to be downloaded and then parsed, compiled, executed —and there are a number of other steps that an engine needs to complete. Just be aware that these costs are not quite equivalent.
One of the reasons why they start to add up and matter is mobile.
Mobile is a spectrum.
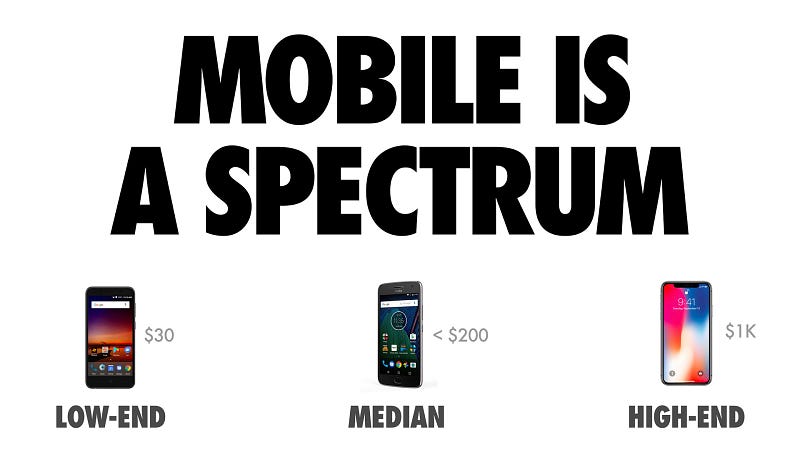
If we’re fortunate, we may have a high-end or median end phone. The reality is that not all users will have those devices.
They may be on a low-end or median phone, and the disparity between these multiple classes of devices can be quite stark due too; thermal throttling, difference in cache sizes, CPU, GPU — you can end up experiencing quite different processing times for resources like JavaScript, depending on the device you’re using. Your users on low-end phones may even be in the U.S.

Here’s a breakdown of how long it takes to parse JavaScript across a spectrum of hardware available in 2018:
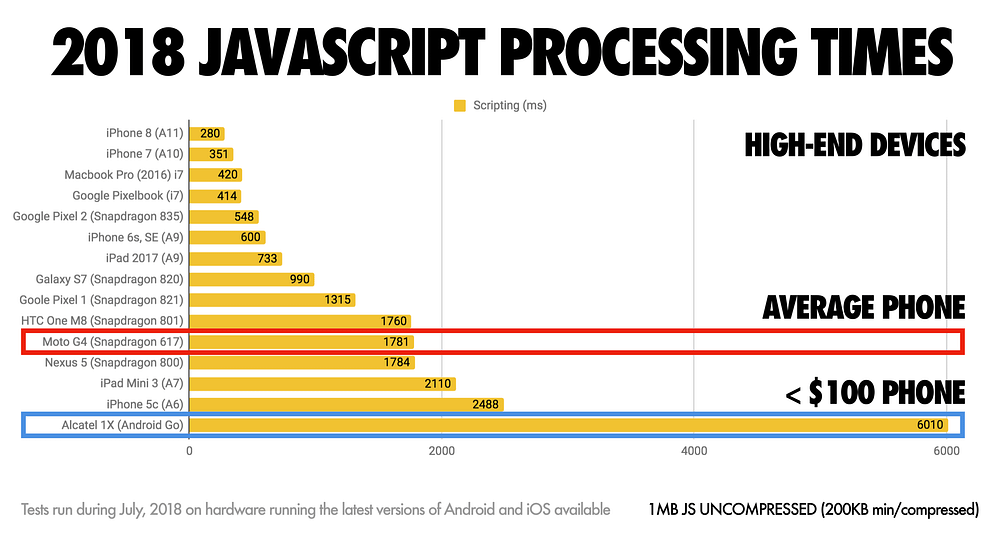
At the top we have high-end devices, like the iPhone 8, which process script relatively quickly. Lower down we have more average phones like the Moto G4 and the <$100 Alcatel 1X. Notice the difference in processing times?
Android phones are getting cheaper, not faster, over time. These devices are frequently CPU poor with tiny L2/L3 cache sizes. You are failing your average users if you’re expecting them to all have high-end hardware.
Let’s look at a more practical version of this problem using script from a real-world site. Here’s the JS processing time for CNN.com:
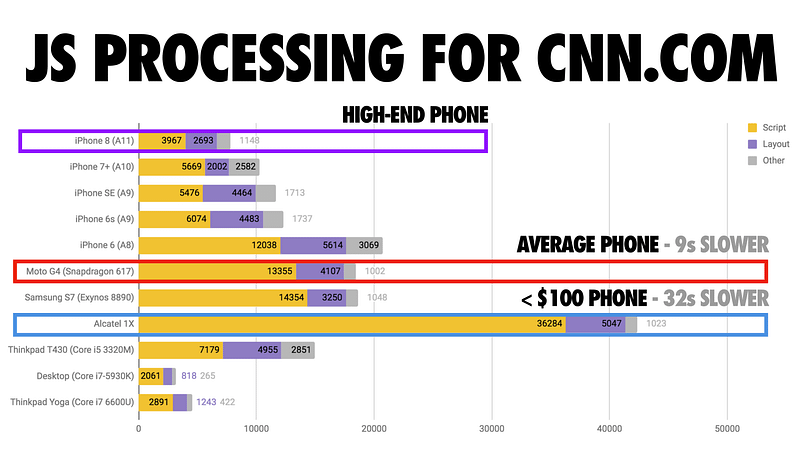
On an iPhone 8 (using the A11 chip) it takes nine seconds less to process CNN’s JavaScript than it does on an average phone. That’s nine seconds quicker that experience could get interactive.
Now that WebPageTest supports the Alcatel 1X (~$100 phone sold in the U.S, sold out at launch) we can also look at filmstrips for CNN loading on mid-lower end hardware. Slow doesn’t even begin to describe this:
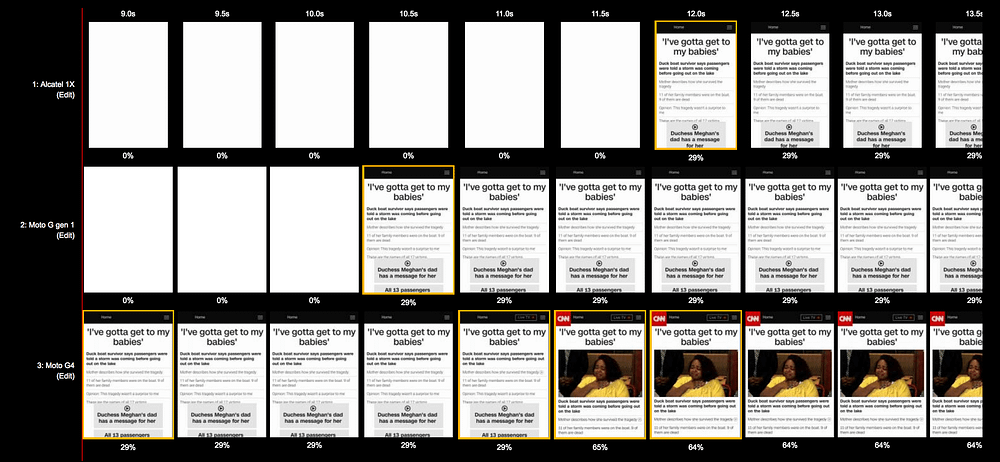
This hints that maybe we need to stop taking fast networks and fast devices for granted.

Some users are not going to be on a fast network or have the latest and greatest phone, so it’s vital that we start testing on real phones and real networks . Variability is a real issue.
“Variability is what kills the User Experience” — Ilya Grigorik. Fast devices can actually sometimes be slow. Fast networks can be slow, variability can end up making absolutely everything slow.
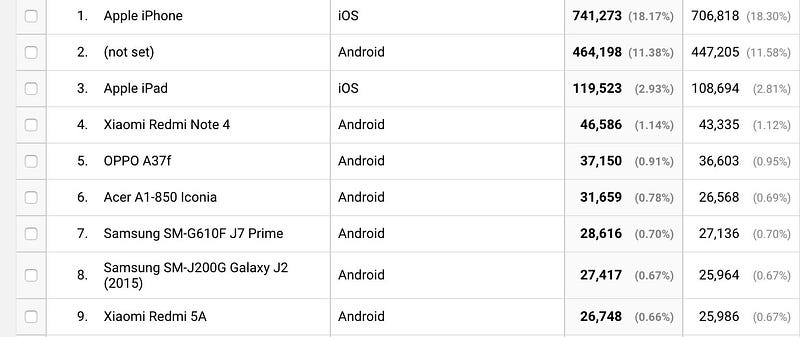
When variance can kill the user experience, developing with a slow baseline ensures everyone (both on fast and slow setups) benefits. If your team can take a look at their analytics and understand exactly what devices your users are actually accessing your site with, that’ll give you a hint at what devices you should probably have in the office to test your site with.

webpagetest.org/easy has a number of Moto G4 preconfigured under the “Mobile” profiles. This is valuable in case you’re unable to purchase your own set of median-class hardware for testing.
There’s a number of profiles set up there that you can use today that already have popular devices pre-configured. For example, we’ve got some median mobile devices like the Moto G4 ready for testing.
It’s also important to test on representative networks. Although I’ve talked about how important low end and median phones are, Brian Holt made this great point: it’s really important to know your audience.

Not every site needs to perform well on 2G on a low-end phone. That said, aiming for a high level of performance across the entire spectrum is not a bad thing to do.
You may have a wide range of users on the higher end of the spectrum, or in a different part of the spectrum. Just be aware of the data behind your sites, so that you can make a reasonable call on how much all of this matters.
If you want JavaScript to be fast, pay attention to download times for low end networks. The improvements you can make there are: ship less code, minify your source, take advantage of compression (i.e., gzip, Brotli, and Zopfli).

Take advantage of caching for repeat visits. Parse time is critical for phones with slow CPUs.

If you’re a back-end or full stack developer, you know that you kind of get what you pay for with respect to CPU, disk, and network.
As we build sites that are increasingly more reliant on JavaScript, we sometimes pay for what we send down in ways that we don’t always easily see.
How to send less JavaScript
The shape of success is whatever let’s us send the least amount of script to users while still giving them a useful experience. Code-splitting is one option that makes this possible.
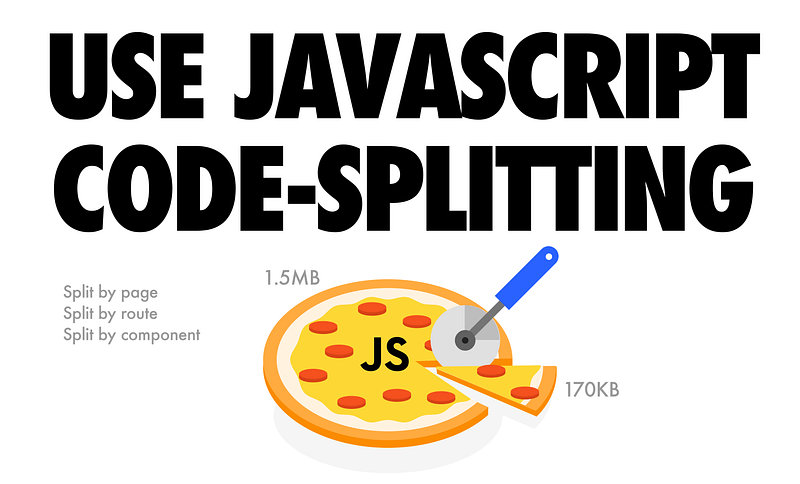
Code-splitting is this idea that, instead of shipping down your users a massive monolithic JavaScript bundle — sort of like a massive full pizza — what if you were to just send them one slice at a time? Just enough script needed to make the current page usable.
Code-splitting can be done at the page level, route level, or component level. It’s something that’s well supported by many modern libraries and frameworks through bundlers like webpack and Parcel. Guides to accomplish this are available for React, Vue.js and Angular.
Many large teams have seen big wins off the back of investing in code-splitting recently.
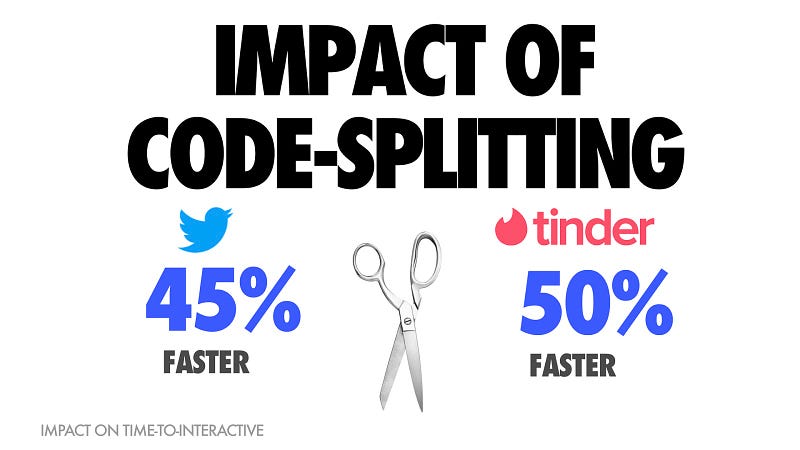
In an effort to rewrite their mobile web experiences to try to make sure users were able to interact with their sites as soon as possible, both Twitter and Tinder saw anywhere up to a 50% improvement in their Time to Interactive when they adopted aggressive code splitting.
Stacks like Gatsby.js (React), Preact CLI, and PWA Starter Kit attempt to enforce good defaults for loading & getting interactive quickly on average mobile hardware.
Another thing many of these sites have done is adopted auditing as part of their workflow.
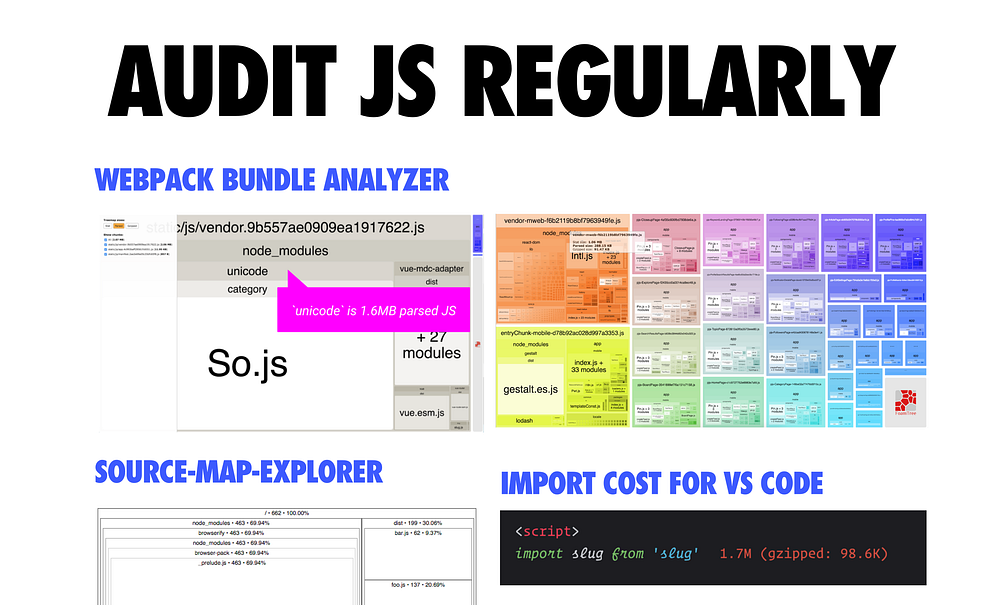
Thankfully, the JavaScript ecosystem has a number of great tools to help with bundle analysis.
Tools like Webpack Bundle Analyzer, Source Map Explorer and Bundle Buddy allow you to audit your bundles for opportunities to trim them down.
These tools visualize the content of your JavaScript bundles: they highlight large libraries, duplicate code, and dependencies you may not need.
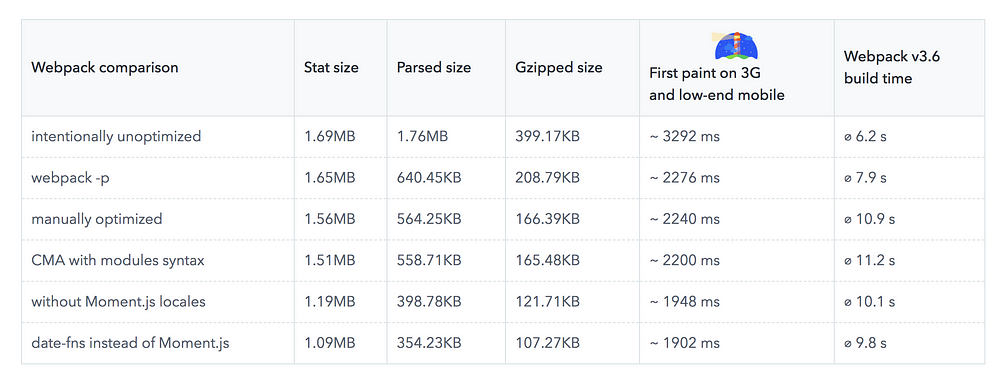
Bundle auditing often highlights opportunities to swap heavy dependencies (like Moment.js and its locales) for lighter alternatives (such as date-fns).
If you use webpack, you may find our repository of common library issues in bundles useful.
Measure, Optimize, Monitor, and Repeat.
If you’re unsure whether you have any issues with JavaScript performance in general, check out Lighthouse:

Lighthouse is a tool baked into the Chrome Developer Tools. It’s also available as a Chrome extension. It gives you an in-depth performance analysis that highlights opportunities to improve performance.

We’ve recently added support for flagging high “JavaScript boot-up time” to Lighthouse. This audit highlights scripts which might be spending a long time parsing/compiling, which delays interactivity. You can look at this audit as opportunities to either split up those scripts, or just be doing less work there.
Another thing you can do is make sure you’re not shipping unused code down to your users:
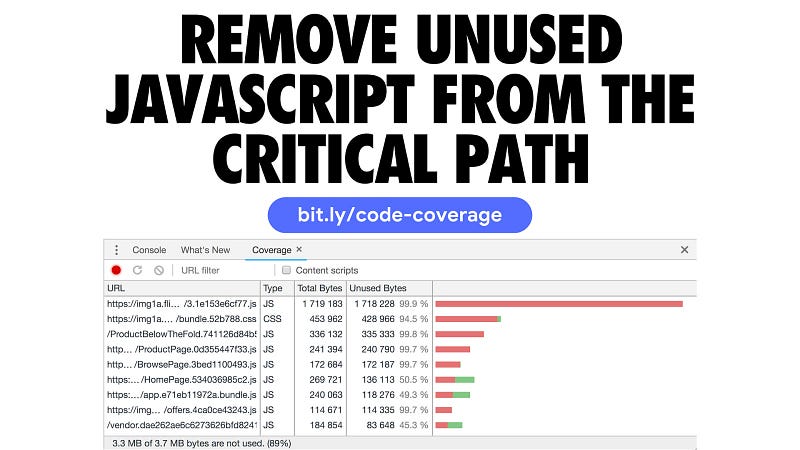
Code coverage is a feature in DevTools that allows you to discover unused JavaScript (and CSS) in your pages. Load up a page in DevTools and the coverage tab will display how much code was executed vs. how much was loaded. You can improve the performance of your pages by only shipping the code a user needs.
Tip: With coverage recording, you can interact with your app and DevTools will update how much of your bundles were used.
This can be valuable for identifying opportunities to split up scripts and defer the loading of non-critical ones until they’re needed.
If you’re looking for a pattern for serving JavaScript efficiently to your users, check out the PRPL pattern.

PRPL (Push, Render, Precache and Lazy-Load) is a pattern for aggressively splitting code for every single route, then taking advantage of a service worker to pre-cache the JavaScript and logic needed for future routes, and lazy load it as needed.
What this means is that when a user navigates to other views in the experience, there’s a good chance it’s already in the browser cache, and so they experience much more reduced costs in terms of booting scripts up and getting interactive.
If you care about performance or you’ve ever worked on a performance patch for your site, you know that sometimes you could end up working on a fix, only to come back a few weeks later and find someone on your team was working on a feature and unintentionally broke the experience. It goes a little like this:

Thankfully, there are ways we can we can try to work around this, and one way is having a performance budget in place.
Performance budgets are critical because they keep everybody on the same page. They create a culture of shared enthusiasm for constantly improving the user experience and team accountability.
Budgets define measurable constraints to allow a team to meet their performance goals. As you have to live within the constraints of budgets, performance is a consideration at each step, as opposed to an after-thought.
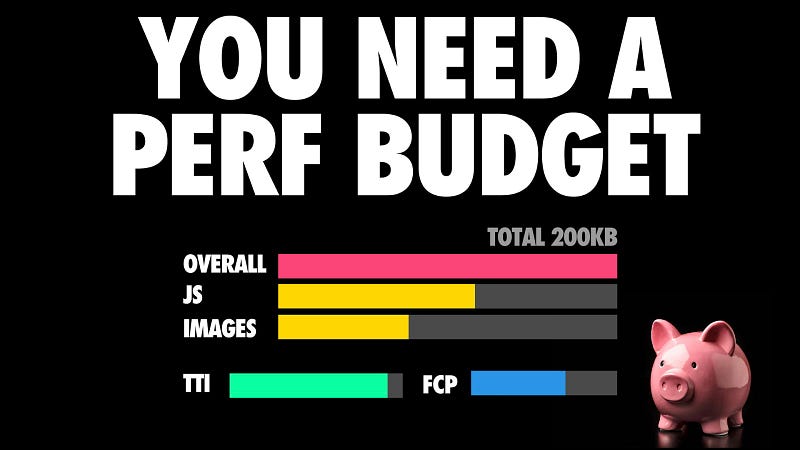
Based on the work by Tim Kadlec, metrics for perf budgets can include:
- Milestone timings — timings based on the user-experience loading a page (e.g Time-to-Interactive). You’ll often want to pair several milestone timings to accurately represent the complete story during page load.
- Quality-based metrics — based on raw values (e.g. weight of JavaScript, number of HTTP requests). These are focused on the browser experience.
- Rule-based metrics — scores generated by tools such as Lighthouse or WebPageTest. Often, a single number or series to grade your site.
Alex Russell had a tweet-storm about performance budgets with a few salient points worth noting:
- “Leadership buy-in is important. The willingness to put feature work on hold to keep the overall user experience good defines thoughtful management of technology products.”
- “Performance is about culture supported by tools. Browsers optimize HTML+CSS as much as possible. Moving more of your work into JS puts the burden on your team and their tools”
- “Budgets aren’t there to make you sad. They’re there to make the organization self-correct. Teams need budgets to constrain decision space and help hitting them”
Everyone who impacts the user-experience of a site has a relationship to how it performs.

Performance is more often a cultural challenge than a technical one.
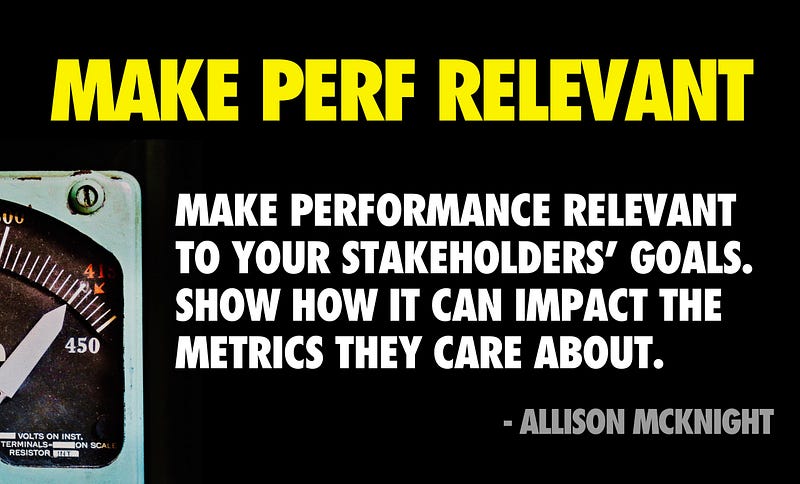
Discuss performance during planning sessions and other get-togethers. Ask business stakeholders what their performance expectations are. Do they understand how perf can impact the business metrics they care about? Ask eng. teams how they plan to address perf bottlenecks. While the answers here can be unsatisfactory, they get the conversation started.
Here’s an action plan for performance:
– Create your performance vision. This is a one-page agreement on what business stakeholders and developers consider “good performance”
– Set your performance budgets. Extract key performance indicators (KPIs) from the vision and set realistic, measurable targets from them. e.g. “Load and get interactive in 5s”. Size budgets can fall out of this. e.g “Keep JS < 170KB minified/compressed”
– Create regular reports on KPIs. This can be a regular report sent out to the business highlighting progress and success.
Web Performance Warrior by Andy Still and Designing for Performance by Lara Hogan are both excellent books that discuss how to think about getting a performance culture in place.
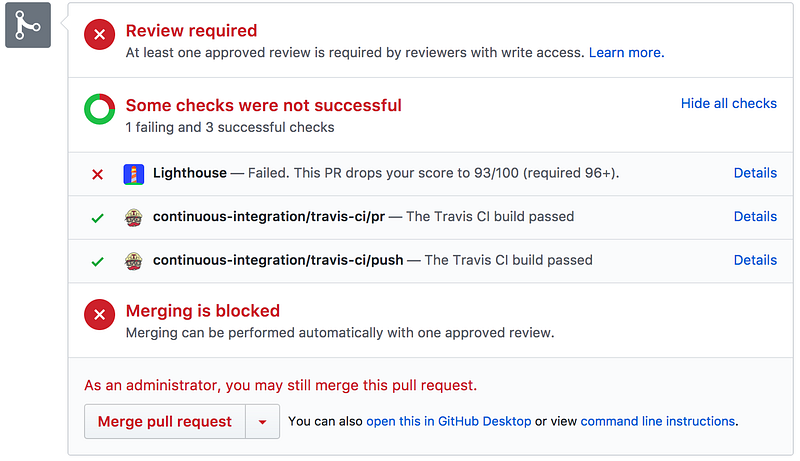
What about tooling for perf budgets? You can setup Lighthouse scoring budgets in continuous integration with the Lighthouse CI project:
A number of performance monitoring services support setting perf budgets and budget alerts including Calibre, Treo, Webdash and SpeedCurve:
Embracing performance budgets encourages teams to think seriously about the consequences of any decisions they make from early on in the design phases right through to the end of a milestone.
Looking for further reference? The U.S Digital Service document their approach to tracking performance with Lighthouse by setting goals and budgets for metrics like Time-to-Interactive.
Next up..
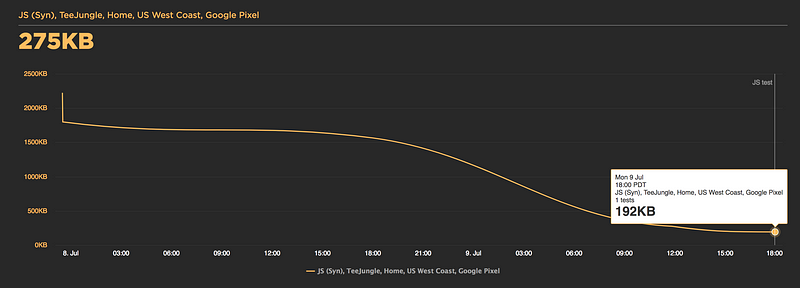
Each site should have access to both lab and field performance data.
To track the impact JavaScript can have on user-experience in a RUM (Real User Monitoring) setting, there are two things coming to the web I’d recommend checking out.
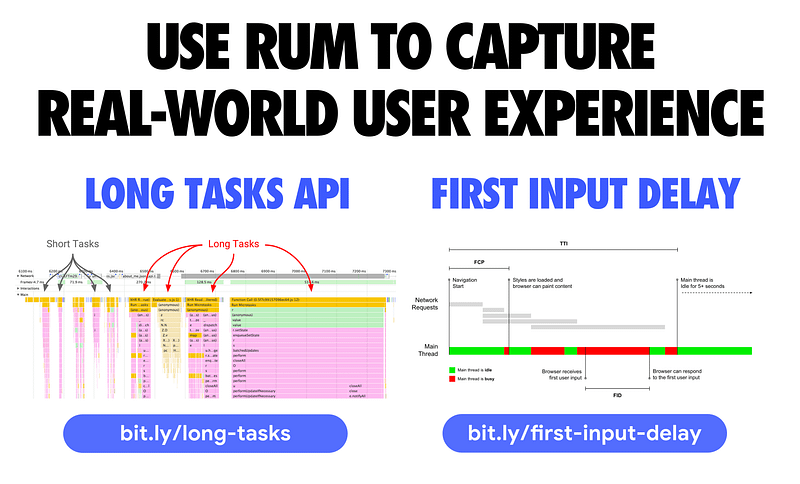
The first is Long Tasks — an API enabling you to gather real-world telemetry on tasks (and their attributed scripts) that last longer than 50 milliseconds that could block the main thread. You can record these tasks and log them back to your analytics.
First Input Delay (FID) is a metric that measures the time from when a user first interacts with your site (i.e. when they tap a button) to the time when the browser is actually able to respond to that interaction. FID is still an early metric, but we have a polyfill available for it today that you can check out.
Between these two, you should be able to get enough telemetry from real users to see what JavaScript performance problems they’re running into.
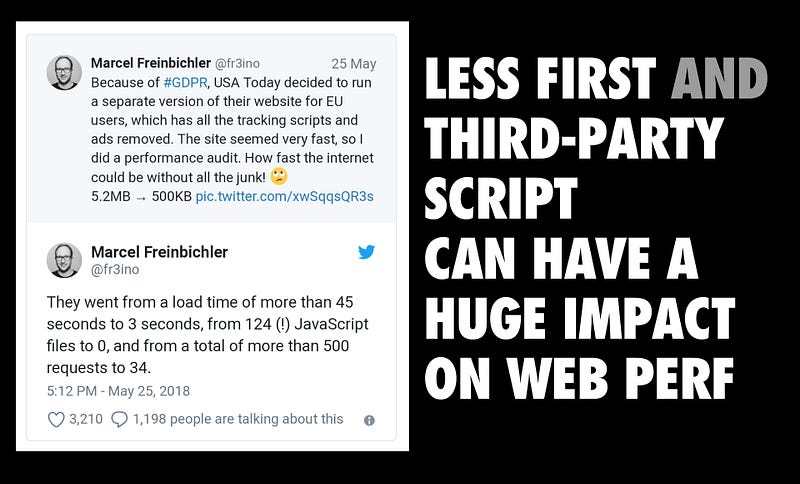
It’s well known that third-party JavaScript can have a dire impact on page load performance. While this remains true, it’s important to acknowledge that many of today’s experiences ship a lot of first-party JavaScript of their own, too. If we’re to load fast, we need to chip away at the impact both sides of this problem can have on the user experience.
There are several common slip-ups we see here, including teams using blocking JavaScript in the document head to decide what A/B test to show users. Or, shipping the JS for all variants of an A/B test down, even if only one is going to actually be used ?
We have a separate guide on loading Third-party JavaScript if this is currently the primary bottleneck you’re experiencing.
Get fast, stay fast.
Performance is a journey. Many small changes can lead to big gains.
Enable users to interact with your site with the least amount of friction. Run the smallest amount of JavaScript to deliver real value. This can mean taking incremental steps to get there.
In the end, your users will thank you.

References
- Can You Afford It?: Real-world Web Performance Budgets
- Progressive Performance
- Reducing JavaScript payloads with Tree-shaking
- Ouch, your JavaScript hurts!
- Fast & Resilient — Why carving out the “fast” path isn’t enough
- Web performance optimization with Webpack
- JavaScript Start-up Optimization
- The Impact Of Page Weight On Load Time
- Beyond The Bubble — Real-world Performance
- How To Think About Speed Tools
- Thinking PRPL
With great thanks to Thomas Steiner, Alex Russell, Jeremy Wagner, Patrick Hulce, Tom Ankers and Houssein Djirdeh for their contributions to this write-up. Also thanks to Pat Meenan for his continued work on WebPageTest — here’s a Lighthouse report for this page if interested. You can follow my work on Twitter.
Eng. Manager at Google working on Chrome • Passionate about making the web fast.